首先修改haproxy.cfg
listen  monitor_stat :8088
        stats   uri /ihaproxy-stats
        stats   realm Haproxy Statistics
        stats   auth ha_house:ZW5dmKRTObmOuA1nnS5U
        stats   hide-version
        bind-process    1
通过命令行方式获取haproxy 检测页面中各后台服务的状态
vim /usr/local/zabbix/etc/monitor_scripts/discoverhaproxy.sh
#!/bin/bash
portarray=(`curl -s --connect-timeout 3 -uha_house:ZW5dmKRTObmOuA1nnS6U "http://$1:8088/ihaproxy-stats;csv"|awk -F',' '{print $1,"-",$2,$18}'|sed "1,2d"|sed 's/ - /-/g'`)
length=${#portarray[@]}
printf "{
"
printf  '	'""data":["
for ((i=0;i<$length;i++))
do
        printf '
		{'
        printf ""{#SERVER_NAME}":"${portarray[$i]}",
"
        ((i+=1))
        printf '		'
        printf ""{#STATUS}":"${portarray[$i]}"}"
        if [ $i -lt $[$length-1] ];then
                printf ','
        fi
done
printf  "
	]
"
printf "}
"
vim /usr/local/zabbix/etc/monitor_scripts/hanode.sh 该脚本是获取backend主机节点的backend名称和状态
#!/bin/bash
a=` curl -s --connect-timeout 3 -uha_house:ZW5dmKRTObmOuA1nnS6U "http://$1:8088/ihaproxy-stats;csv"|awk -F',' '{print $1,"-",$2,$18}'|sed "1,2d"|sed 's/ - /-/g'|grep -w $2|awk '{print $2}' `
echo $a
a 的值显示为:
agent_server-agent_45 UP
agent_server-agent_46 UP
agent_server-agent_47 UP
agent_server-BACKEND UP
zabbix键值自定义:
vim /usr/local/zabbix/etc/zabbix_agentd.conf.d/haproxy.conf
UserParameter=dishaproxy[*],/usr/local/zabbix/etc/monitor_scripts/discoverhaproxy.sh $1
UserParameter=hanode[*],/usr/local/zabbix/etc/monitor_scripts/hanode.sh $1 $2


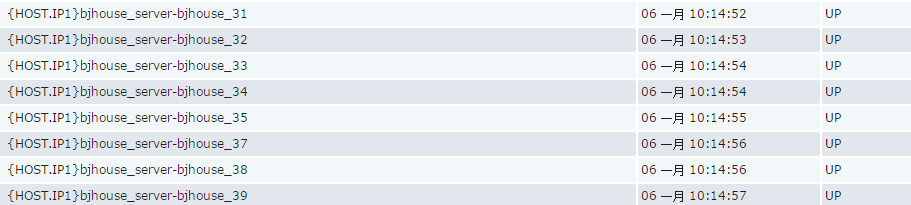
查看主机的最新数据就会出现所有backend主机的状态: