一、在phpstudy配置
开启xdebug的zend扩展,在php.ini 中添加下面的代码:
[xdebug]
zend_extension = "D:phpstudy_proExtensionsphpphp7.3.4ntsextphp_xdebug.dll"
xdebug.trace_output_dir=D:/phpstudy_pro/Extensions/php_log/php7.3.4nts.xdebug.trace
xdebug.profiler_output_dir=D:/phpstudy_pro/Extensions/php_log/php7.3.4nts.xdebug.profiler
xdebug.remote_enable = On
xdebug.remote_port=9010
xdebug.remote_autostart=1
xdebug.auto_trace=1
xdebug.remote_log=D:phpstudy_proExtensionsphpphp7.3.4ntsxdebug.log
保存后,重启nginx服务。
二、设置PHPstorm中的配置
1、在phpstorm中设置 php相对应的版本 File | Settings | Languages & Frameworks | PHP

2、设置 Debug File | Settings | Languages & Frameworks | PHP | Debug
修改端口号 将9000修改为在php.ini中设置的port 9010。因为9000这个端口有线程端口的冲突,所以需要修改一下。

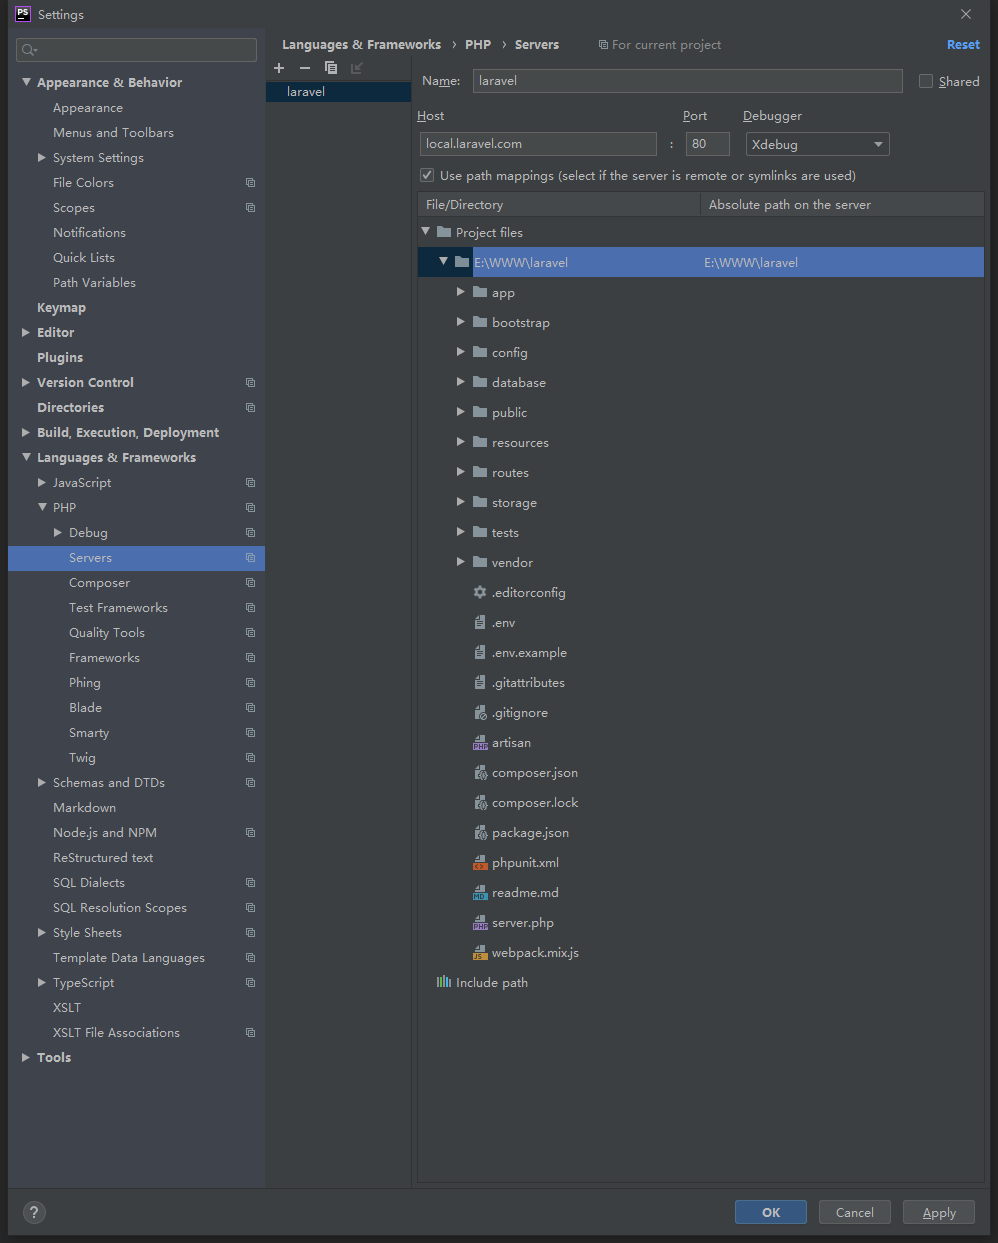
3、添加服务(servers) File | Settings | Languages & Frameworks | PHP | Servers
指定到项目的根目录,我用的是laravel 所以就 指定到laravel 根目录就行,不需要指定到public目录中,因为nginx中已经配置环境了
4、设置完后开启debug

5、打断点
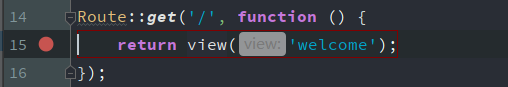
6、刷新打断点的页面后 phpstorm 底部就会出现打断点的相关信息
