关于计划任务的一个小需求-实现
之前博客【关于计划任务的一个小需求:https://www.cnblogs.com/windysai/p/14352248.html】给读者抛了个问题。真正实现都算是完成得差不多了,历时1周多,大概记录下。
主要分两大部分来实现:
1、监控计划任务进程存活
2、监控定时脚本是否按时跑起来
首先这两个实现方法都是基于prometheus+grafana+alertmanager这个监控系统啦,报警媒介是钉钉【利用github开源项目prometheus-webhook-dingtalk实现@我的:https://www.cnblogs.com/windysai/p/14421684.html】。
使用到的工具,版本如下:
(1)prometheus:2.24.1
(2)grafana:7.3.7
(3)process-exporter:0.7.5
(4)alertmanager:0.21.0
(5)prometheus-webhook-dingtalk:0.3.0
(6)pushgateway:1.4.0
一、监控计划任务进程存活
进程监控工具用到:process-exporter,主要用来监控crond的存活
1、编写规则文件:process.yml
groups:
- name: general.rules
  rules:
  - alert: CrondProcess
    expr: namedprocess_namegroup_num_procs{groupname="map[:crond]"} < 1

    for: 1m
    labels:
      severity: warning
    annotations:
      summary: "{{ $labels.nodename  }} :计划任务进程crond挂了!!!"
精髓在于: namedprocess_namegroup_num_procs{groupname="map[:crond]"} < 1
进程挂了的判断条件
2、prometheus.yml,加载这个进程规则文件
# my global config
global:
    。。。
# Alertmanager 配置
alerting:
  alertmanagers:
  - static_configs:
    - targets: ['localhost:9093']

# 报警规则文件加载
rule_files:
    - "/usr/local/src/monitor/prometheus/rules/testgw.yml"       #定时脚本是否按时跑的报警规则文件
    - "/usr/local/src/monitor/prometheus/rules/process.yml"      #crond进程监控报警规则文件

scrape_configs:
  - job_name: '测试机器名-process'
    static_configs:
    - targets: ['测试机器IP:9256']
      labels:
        nodename: 测试机器名

  - job_name: 'push-metrics'
    static_configs:
    - targets: ['测试机器IP:9091']
    honor_labels: true
3、alertmanger和prometheus-webhook-dingtalk的配置可以参考之前文章:https://www.cnblogs.com/windysai/p/14421684.html
告警排版优化我到时贴个链接【允许我先留空,都做了的】
最终成品如下:

二、监控定时脚本是否按时跑起来
老实说,搞这个玩意死了不少脑细胞,今天算是发现新大陆~~~至于有无bug,明天再测下。
想法一开始是这样的:
(1)成功运行一次定时脚本(测的定时脚本是每5分钟跑一次),写入pushgateway某个job(9091是pushgateway的默认端口)
例如:echo "test_metric 1" | curl --data-binary @- http://机器IP:9091/metrics/job/test_job
(2)pushgateway_http_requests_total ,请求方法为post,prometheus查到会进行+1运算。
(3)规则文件监控:increase(pushgateway_http_requests_total[5m]),为0则报警(代表没变化,也就是没push数据没有跑脚本),大家肯定能想明白的
其中:pushgateway_http_requests_total[5m]) 表示每5分钟有多少次post的请求数
后来改成用push_time_seconds,因为不用在prometheus.yml定义多个job名来区分(后续我会补上踩坑点)
每跑一次定时脚本,都会push一条数据到上面,其中有个push数据的记录时间push_time_seconds;不跑就不会push,push_time_seconds还是原来的值。然后利用prometheus函数:increase(push_time_seconds[6m])去计算差值,差值为0代表没变化,也就是上一次没跑,跟上面实现思路本质上是一致的。
如何测试这个过程?
1、计划任务挂一个定时脚本,模拟某个时间点,脚本没跑

脚本内容如下(其中日志记录文件:/tmp/testgw.log 是为了双重保险的)
#!/bin/bash
DATE=`date +%F_%H:%M`
echo "$DATE ### 成功运行了脚本testgw.sh!!!!" >> /tmp/testgw.log

echo "testjob1 1" | curl --data-binary @- http://本机ip:9091/metrics/job/test_job1
2、规则文件:testgw.yml(留意上面已经加载了)
 1 groups:
 2 - name: general.rules
 3   rules:
 4   - alert: pushgw
 5     expr: increase(push_time_seconds{job="test_job1"}[6m]) == 0
 6
 7     for: 1m
 8     labels:
 9       severity: warning
10     annotations:
11       summary: "pushgw没有跑(定时脚本这个时间点没跑)!!!"
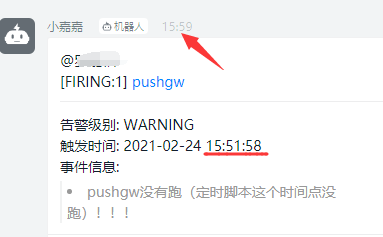
最终报警如下图:

有个问题是竟然不会打印当前机器人报警的时间,只有触发时间。这两个时间不一定同,如下图:
改了prometheus-webhook-dingtalk加载的模板文件(go语言写的,/config/example.tmp)没有一毛钱反应 = =,成了心中永远的一个谜
