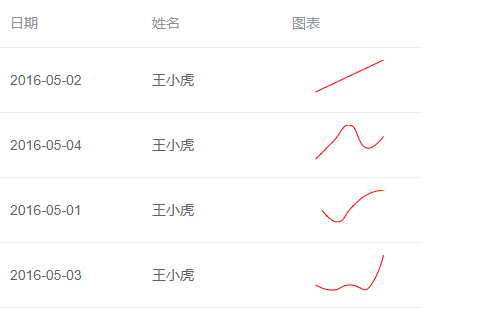
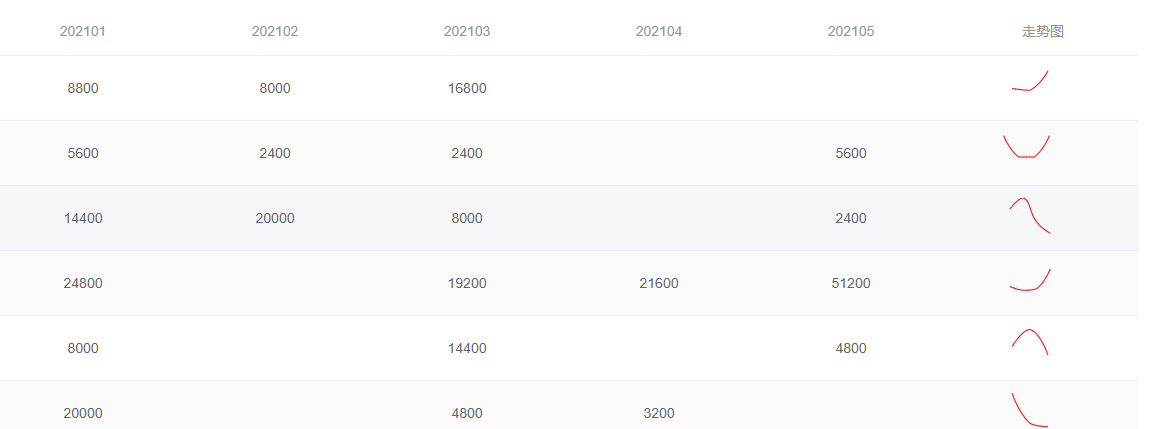
效果:
代码:
<template>
  <div>
    <el-table
        :data="tableData">
      <el-table-column
          prop="date"
          label="日期"
          width="180">
      </el-table-column>
      <el-table-column
          prop="name"
          label="姓名"
          width="180">
      </el-table-column>
      <el-table-column prop="name">
        <template slot-scope="scope">
          <div style="height: 40px;100px" :ref="'echarts'+scope.row.id"></div>
        </template>
      </el-table-column>
    </el-table>

  </div>
</template>

<script>
export default {
  data() {
    return {
      tableData: []
    }
  },
  mounted() {
   this.init()
  },
  methods: {
    init() {
      this.tableData = [
        {
          date: '2016-05-02',
          name: '王小虎',
          id: '1',
          num: [1, 2, 3, 4, 5]
        }, {
          id: '2',
          date: '2016-05-04',
          name: '王小虎',
          num: [1, 4, 7, 3, 5]
        }, {
          id: '3',
          date: '2016-05-01',
          name: '王小虎',
          num: [5, 2, 6, 9, 10]
        }, {
          id: '4',
          date: '2016-05-03',
          name: '王小虎',
          num: [2, 1, 2, 1, 8]
        }
      ];

      this.getEcharts()
    },
    getEcharts() {
      setTimeout(_ => {
        this.tableData.forEach(e => {
          let myChart = echarts.init(this.$refs['echarts' + e.id]);
          myChart.setOption({
            grid: {
              left: "0",
              top: "0",
              right: "0",
              bottom: "0",
              containLabel: true,
            },
            xAxis: {
              type: 'category',
              //不显示x轴线
              show: false,

            },
            yAxis: {
              type: 'value',
              show: false,
            },
            series: [{
              data: e.num,
              //单独修改当前线条的颜色
              lineStyle: {
                normal: {
                  color: "#f00",
                   1,
                },
              },
              type: 'line',
              smooth: true,
              symbol: 'none',
            }]

          });
          window.addEventListener("resize", () => {
            myChart.resize();
          });
        })
      }, 1000)
    }
  }
}
</script>