pandas两种主要的数据结构:Series和DataFrame
Series:类似于一维数组的对象,由一组数据以及一组与之相关的数据标签(即索引)组成。Series中的索引值可以重复
DataFrame:一个表格型的数据结构,包含有一组有序的列,每列可以是不同的值类型(数值、字符串、布尔型等),DataFrame即有行索引也有列索引,可以被看成是Series组成的字典
1. Seriess
通过一维数组创建:
arr = np.array([1,2,3,4,np.NaN])
series1 = Series(arr)
自定义Series索引:
series2 = Series([90,80,85])
series2.index = [u'语文',u'数学',u'英语']
print(series2)

series2 = Series([90,80,70],index=[u'语文',u'数学',u'英语'])
print(series2)

RangeIndex(start=0, stop=5, step=1)
语文    90
数学    80
英语    85
通过字典方式创建,key重复会被后面的覆盖:
dict1 = {'一':100,'二':200,'三':300,'一':500}
series3 = Series(dict1)
print(series3)
print(series3.index)
print(series3.values)
print(series3.dtype)

一    500
三    300
二    200
dtype: int64
Index([u'一', u'三', u'二'], dtype='object')
[500 300 200]
int64
Series索引可以重复:
series4 = Series([90,80,70,100])
series4.index = [u'一',u'二',u'三',u'一']
print(series4)
print(series4[u'一'])

一     90
二     80
三     70
一    100
dtype: int64
一     90
一    100
dtype: int64
Series的运算
series = Series({'101': -100,'102':200,'103': 300})
print(series)
print(series > 100)
print(series / 100)
print(np.fabs(series))
print(np.exp(series))

101   -100
102    200
103    300
dtype: int64
101    False
102     True
103     True
dtype: bool
101   -1.0
102    2.0
103    3.0
dtype: float64
101    100.0
102    200.0
103    300.0
dtype: float64
101     3.720076e-44
102     7.225974e+86
103    1.942426e+130
dtype: float64
Series缺失值检测
scores = Series({'a':90,'b':80,'c':95})
new = ['a','b','cc','c','d']
scores1 = Series(scores,index=new)
print scores1
print(pd.isnull(scores1))
print(scores1[pd.isnull(scores1)])
print(scores1[pd.notnull(scores1)])

a     90.0
b     80.0
cc     NaN
c     95.0
d      NaN
dtype: float64
a     False
b     False
cc     True
c     False
d      True
dtype: bool
cc   NaN
d    NaN
dtype: float64
a    90.0
b    80.0
c    95.0
dtype: float64
Series自动对齐,在进行运算时会自动匹配相同的索引进行运算
s1 = Series([1,2,3],index=['p1','p2','p3'])
s2 = Series([4,5,6,7],index=['p2','p3','p4','p5'])
print(s1+s2)

p1    NaN
p2    6.0
p3    8.0
p4    NaN
p5    NaN
dtype: float64
2. DataFrame
通过二维数组创建:
df = DataFrame([['a','b','c','d'],[1,2,3,4]])
print(df)
   0  1  2  3
0  a  b  c  d
1  1  2  3  4

arr = np.array([
    [1,2,3,4],
    [2,3,4,5],
    [3,4,5,6]
])

df = DataFrame(arr,index=['one','two','three'],columns=['a','b','c','d'])   #index是行索引,columns是列索引
print(df)
print(df.values)
 a  b  c  d
one    1  2  3  4
two    2  3  4  5
three  3  4  5  6
[[1 2 3 4]
 [2 3 4 5]
 [3 4 5 6]]
通过字典方式创建:
dict1 = {
    'a': ['100','101','102'],
    'b': ['1','2','3'],
    'year': ['2019','2018','2017'],
    'month': '06'
}

df = DataFrame(dict1)   #字典形式创建的DataFrame,key会做为列索引
df.index = ['one','two','three']
print(df)

         a  b month  year
one    100  1    06  2019
two    101  2    06  2018
three  102  3    06  2017
DataFrame数据获取:
可以直接通过列索引获取指定列的数据 df[column_name]
通过ix方法来获取对应行索引的行数据 df.ix[index_name]
dataframe删除原来行索引,重新建立从0开始的索引:
df.reset_index(drop=True)
按指定列排序 dataframe sort_values
升序:
df.sort_values(by="sales" ) by 指定列
降序:
df.sort_values(by="sales" , ascending=False) by 指定列
遍历dataframe:
 for index, row in oneTweetDf.iterrows():
    if index == 0:
       lineData = row.tolist()
    else:
       lineData.extend([row["CrwalTime"], row["Like"], row["Transfer"], row["Comment"]])
3. pandas基本功能
3.1.读写文件
读文件常用的方法是read_csv
df = pd.read_csv("C:/Users/ADMIN/Desktop/data.txt",sep=";",header=None) #header=None,第一行数据不作为索引
print(df)

       0   1   2   3     4
0  gerry  18  90  95  96.0
1    tom  20  92  94   NaN
2   lili  21  98  97  96.0
写文件 writer
file = codecs.open(fileName, 'wb', "utf_8_sig")
csv_writer = csv.writer(finaFile)
#写一行
csv_writer .writerow(header)
#写多行
csv_writer.writerows(datas)
3.2.索引、选取和数据过滤
pandas数据过滤
columns = ['name','age',u'语文',u'数学',u'英语']
df.columns = columns
print(df)

print(df[columns[2:]])

    name  age  语文  数学    英语
0  gerry   18  90  95  96.0
1    tom   20  92  94   NaN
2   lili   21  98  97  96.0
   语文  数学    英语
0  90  95  96.0
1  92  94   NaN
2  98  97  96.0
删除NaN的行
print(df.dropna()) #删除整行包含nan值的行数据
print(df.dropna(how="all")) #删除整行全是nan值的行数据
填充数据fillna
df = DataFrame(np.random.randn(7,3))
df.ix[:4,1] = np.nan
df.ix[:2,2] = np.nan
print(df)
print(df.fillna(0)) #填充所有nan
print(df.fillna({1:1,2:2})) #按列进行填充

 0         1         2
0 -1.181993       NaN       NaN
1 -1.537796       NaN       NaN
2 -0.334437       NaN       NaN
3 -0.629362       NaN  1.336971
4 -0.476075       NaN  1.410920
5  0.661803  1.926648  1.311989
6  0.160683  0.294160 -0.341011
          0         1         2
0 -1.181993  0.000000  0.000000
1 -1.537796  0.000000  0.000000
2 -0.334437  0.000000  0.000000
3 -0.629362  0.000000  1.336971
4 -0.476075  0.000000  1.410920
5  0.661803  1.926648  1.311989
6  0.160683  0.294160 -0.341011
          0         1         2
0 -1.181993  1.000000  2.000000
1 -1.537796  1.000000  2.000000
2 -0.334437  1.000000  2.000000
3 -0.629362  1.000000  1.336971
4 -0.476075  1.000000  1.410920
5  0.661803  1.926648  1.311989
6  0.160683  0.294160 -0.341011
3.3.算法运算和数据对齐
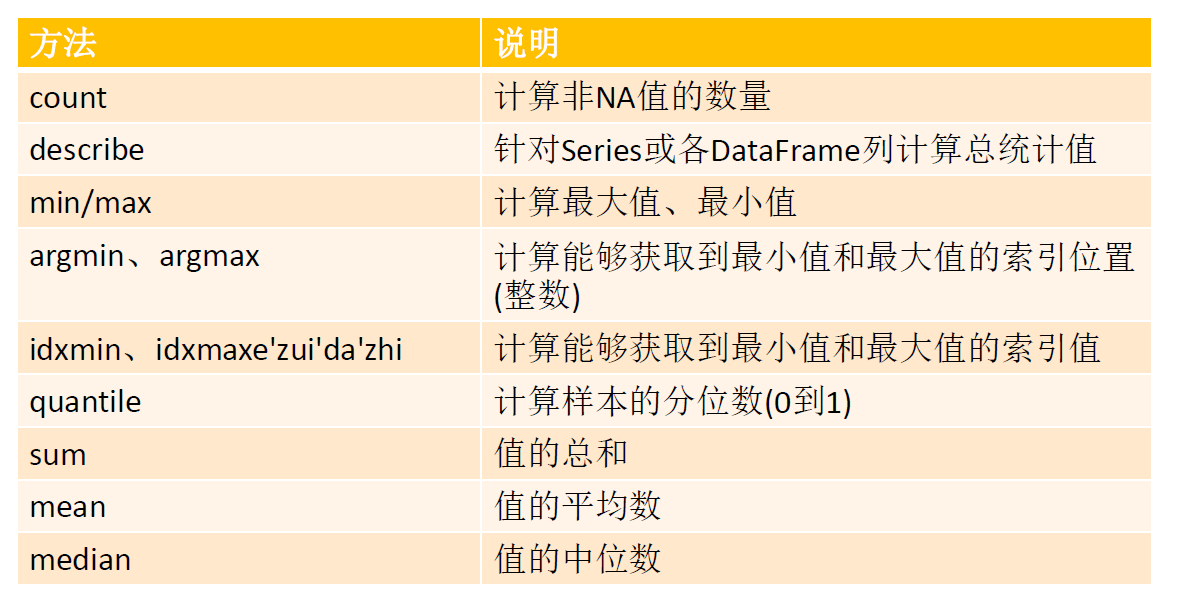
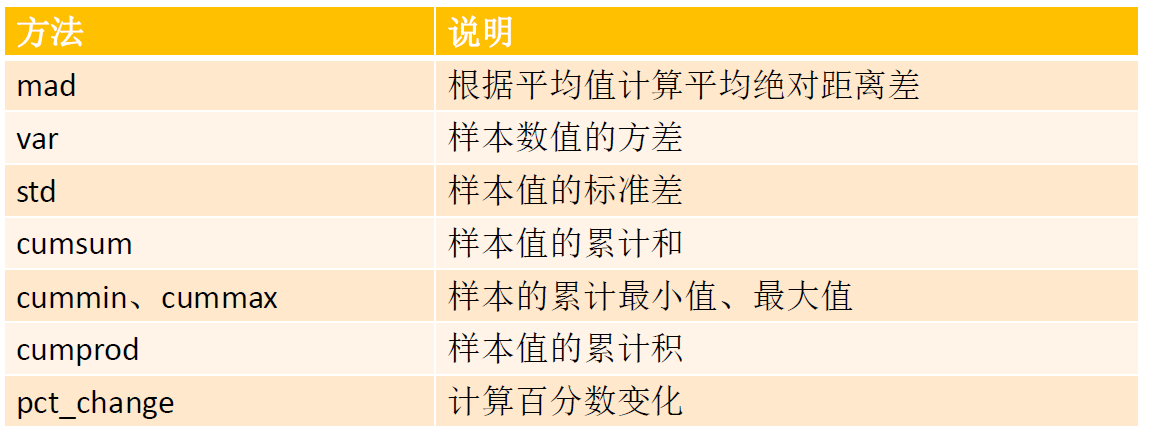
常用的数据统计方法:
相关系数与协方差:
df = DataFrame({
    "GDP":[12,23,34,20,30],
    "air_temperture": [26,27,30,28,29],
    "year": ['2001','2002','2003','2004','2005']
})
print(df)
print u"相关系数:
",df.corr()
print u"协方差:
", df.cov()
print df['GDP'].corr(df['air_temperture'])
print df['GDP'].cov(df['air_temperture'])
pandas唯一值、值计数以及成员资格
ser = Series(['a','b','c','d','a','b'])
print(ser)
print ser.unique()  #去重
print ser.value_counts()    #计数,默认按值出现频率降序排列
mask = ser.isin(['b','c'])  #判断每个元素是否为b或c
print mask
print(ser[mask])

0    a
1    b
2    c
3    d
4    a
5    b
dtype: object
['a' 'b' 'c' 'd']
b    2
a    2
d    1
c    1
dtype: int64
0    False
1     True
2     True
3    False
4    False
5     True
dtype: bool
1    b
2    c
5    b
dtype: object
pandas层次索引
df = DataFrame({
    'year': [2005,2005,2006,2006,2007],
    'fruit': ['apple','banana','apple','banana','apple'],
    'production': [2000,2500,3000,2400,3200],
    'profits': [100,150,200,300,210]
})

df = df.set_index(['year','fruit'])
print(df)

             production  profits
year fruit
2005 apple         2000      100
     banana        2500      150
2006 apple         3000      200
     banana        2400      300
2007 apple         3200      210

print df.ix[2005,'apple']

production    2000
profits        100
按层次化索引进行数据统计
print df.sum(level='year')
print df.mean(level='fruit')
print df.min(level=['fruit'])

  production  profits
year
2005        4500      250
2006        5400      500
2007        3200      210
         production  profits
fruit
apple   2733.333333    170.0
banana  2450.000000    225.0
        production  profits
fruit
apple         2000      100
banana        2400      150