python机器学习-乳腺癌细胞挖掘(博主亲自录制视频)


数据来源
https://github.com/thomas-haslwanter/statsintro_python/tree/master/ISP/Code_Quantlets/08_TestsMeanValues/anovaTwoway


# -*- coding: utf-8 -*-
"""
Created on Tue May 30 10:16:54 2017

@author: daxiong
"""

# Import standard packages
import numpy as np
import pandas as pd

# additional packages
from statsmodels.formula.api import ols
from statsmodels.stats.anova import anova_lm

# Get the data
inFile = 'altman_12_6.txt'
data = np.genfromtxt(inFile, delimiter=',')

def anova_interaction(data):
    '''ANOVA with interaction: Measurement of fetal head circumference,
    by four observers in three fetuses, from a study investigating the
    reproducibility of ultrasonic fetal head circumference data.
    '''


    # Bring them in DataFrame-format
    df = pd.DataFrame(data, columns=['hs', 'fetus', 'observer'])

    # Determine the ANOVA with interaction
    #C(fetus):C(observer)表示两者的交互
    formula = 'hs ~ C(fetus) + C(observer) + C(fetus):C(observer)'
    lm = ols(formula, df).fit()
    anovaResults = anova_lm(lm)
    # --- >>> STOP stats <<< ---
    print(anovaResults)

    return  anovaResults['F'][0]

anova_interaction(data)
'''
                      df      sum_sq     mean_sq            F        PR(>F)
C(fetus)               2  324.008889  162.004444  2113.101449  1.051039e-27
C(observer)            3    1.198611    0.399537     5.211353  6.497055e-03
C(fetus):C(observer)   6    0.562222    0.093704     1.222222  3.295509e-01
Residual              24    1.840000    0.076667          NaN           NaN

fetus和observer的交互没有显著影响
3.295509e-01>0.05
Out[5]: True

6.497055e-03<0.05
Out[6]: True

'''
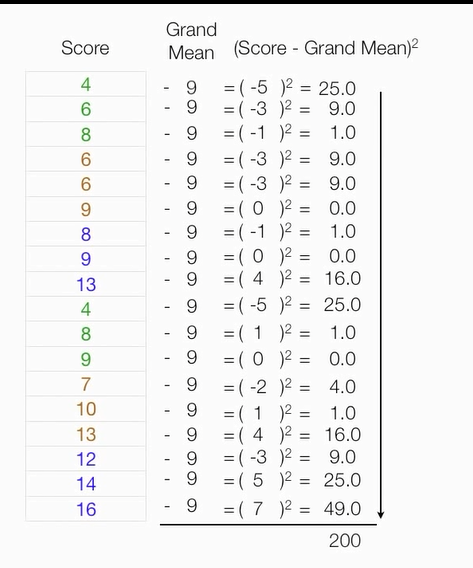
原数据

H0假设

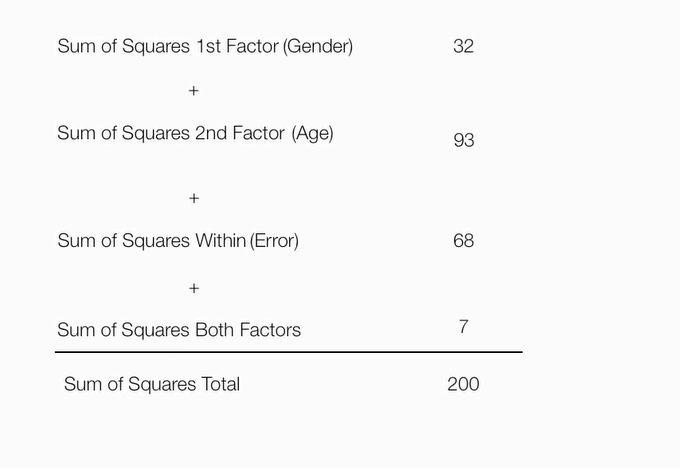
平方和总计=因素1平方和+因素2平方和+因素1*因素2+组内误差平方和

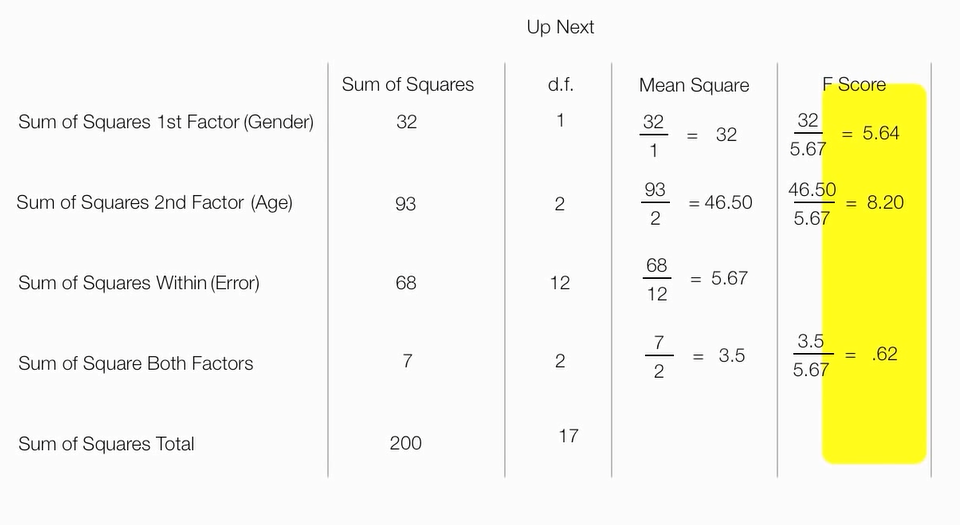
计算的F分数表
红色区间就拒绝H0

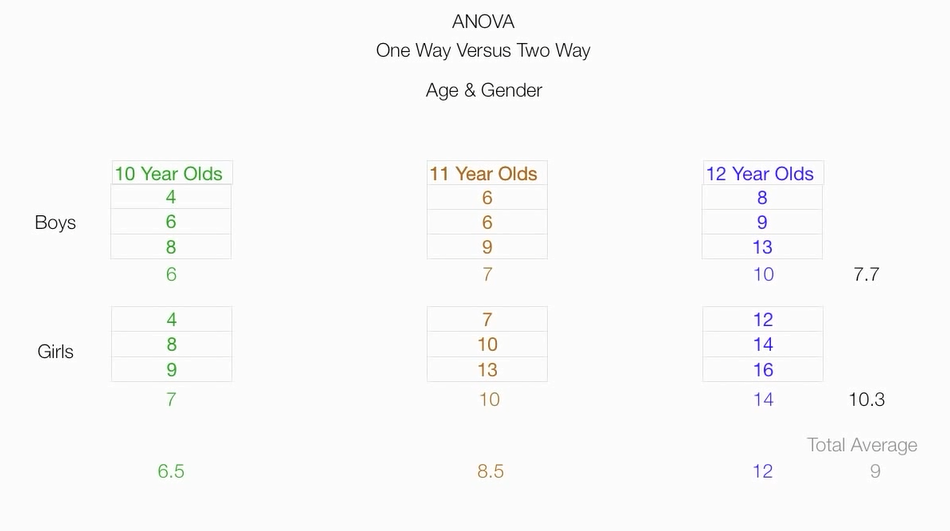
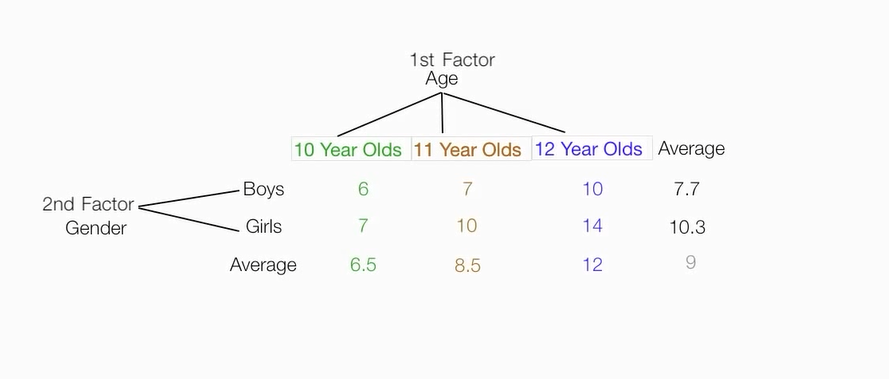
根据两个因素,把原始数据分为六个组,并计算六个组的均值,组成一个矩阵
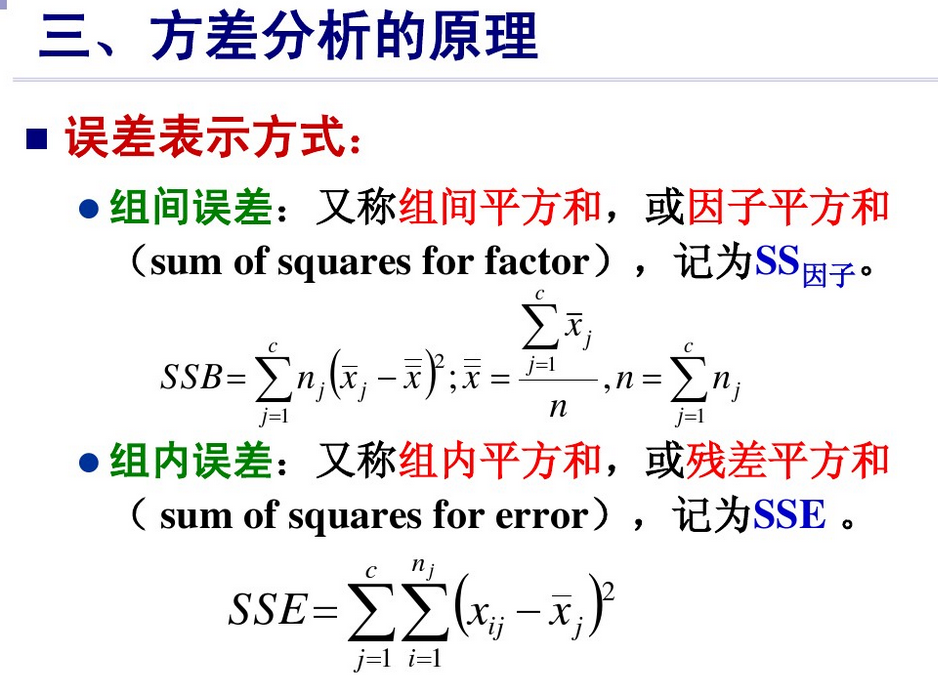
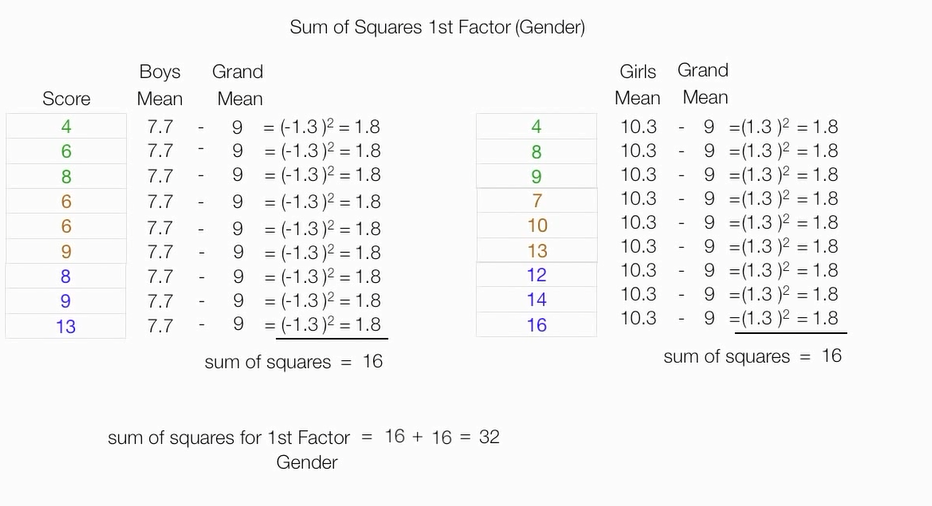
计算性别因素的平方和
计算年龄因素平方和

计算组内误差平方和

总平方和
两个因素平方和=总平方和 - 第一个因素平方和 - 第二个因素平方和 - 组内误差平方和
算出来为7

计算F分数,
F_第一因素=第一因素平方和/组内误差平方和
F_第二因素=第二因素平方和/组内误差平方和
F_第一第二因素交互=第一第二因素交互平方和/组内误差平方和

spss应用
R**2=0.518,年龄和性别对分数影响只占了一半,还有其他因素造成分数的波动。


python代码测试结果和spss一致
# -*- coding: utf-8 -*-
'''
Name of QuantLet: ISP_anovaTwoway

Published in:  An Introduction to Statistics with Python

Description: 'Two-way Analysis of Variance (ANOVA)
    The model is formulated using the <patsy> formula description. This is very
    similar to the way models are expressed in R.'

Keywords: plot, fitting, two-way anova

See also: 'ISP_anovaOneway, ISP_kruskalWallis,
    ISP_multipleTesting, ISP_oneGroup, ISP_twoGroups'

Author: Thomas Haslwanter

Submitted: October 31, 2015

Datafile: altman_12_6.txt

Two-way Analysis of Variance (ANOVA)
The model is formulated using the "patsy" formula description. This is very
similar to the way models are expressed in R.
'''

# Copyright(c) 2015, Thomas Haslwanter. All rights reserved, under the CC BY-SA 4.0 International License

# Import standard packages
import numpy as np
import pandas as pd

# additional packages
from statsmodels.formula.api import ols
from statsmodels.stats.anova import anova_lm

excel = 'score_age_gender.xlsx'


def anova_interaction(inFile):
    '''ANOVA with interaction: Measurement of fetal head circumference,
    by four observers in three fetuses, from a study investigating the
    reproducibility of ultrasonic fetal head circumference data.
    '''

    # Get the data

    df=pd.read_excel(excel)

    # --- >>> START stats <<< ---
    # Determine the ANOVA with interaction
    formula = 'score ~ C(gender) + C(age) + C(gender):C(age)'
    lm = ols(formula, df).fit()
    anovaResults = anova_lm(lm)
    # --- >>> STOP stats <<< ---
    print(anovaResults)

    return  anovaResults['F'][0]

if __name__ == '__main__':
    anova_interaction(excel)

方差分析样本量:
方差分析前提是样本符合正态分布,样本量越大,正态分布可能就越高。
if we suppose that you have k groups, N is the total sample size for all groups, then n-k should exceeds zero. Otherwise, there is no minimum size for each group except you need 2 elements for each to enable calculating the variance, but this is just a theoretical criteria.
However, to use ANOVA you need the check the Normal distribution for each group, so the higher size of your groups sizes, the more opportunity to have the Normal distribution.
Is there a minimum number per group neccessary for an ANOVA?. Available from: https://www.researchgate.net/post/Is_there_a_minimum_number_per_group_neccessary_for_an_ANOVA [accessed Jun 2, 2017].
由于分组的样本量太小,单独两两检验时,发现与双因素方差检验结果不一致,年龄有显著差异,性别无显著差异
双因素方差检验:年龄,性别都有显著不同
# -*- coding: utf-8 -*-

# additional packages
from scipy.stats.mstats import kruskalwallis
import scipy.stats as stats
import numpy as np
import scipy as sp


#性别和成绩是否有关
#性别分为:男孩+女孩
list_boys=[4,6,8,6,6,9,8,9,13]
list_girls=[4,8,9,7,10,13,12,14,16]
list_group=[list_boys,list_girls]

#三组非正太分布数据检验
def Kruskawallis_test(list_group):
    # Perform the Kruskal-Wallis test,返回True表示有显著差异,返回False表示无显著差异
    print"Use kruskawallis test:"

    h, p = kruskalwallis(list_group)
    print"H value:",h
    print"p",p

    # Print the results
    if p<0.05:
        print('There is a significant difference.')
        return True
    else:
        print('No significant difference.')
        return False

#两组非正太分布数据检验
def Mannwhitneyu(group1, group2):
    if np.int(sp.__version__.split('.')[1]) > 16:
        u, p_value = stats.mannwhitneyu(group1, group2, alternative='two-sided')
    else:
        u, p_value = stats.mannwhitneyu(group1, group2, use_continuity=True)
        p_value *= 2    # because the default was a one-sided p-value
    print(("Mann-Whitney test", p_value))
    if p_value<0.05:
        print "there is significant difference"
    else:
        print "there is no significant difference"


'''
正态性符合

NormalTest(list_group)
use shapiro:
p of normal: 0.407877713442
data are normal distributed
use shapiro:
p of normal: 0.99165725708
data are normal distributed
Out[50]: True
'''
#独立T检验
print(stats.ttest_ind(list_boys,list_girls))
'''
#性别和成绩无显著相关
Ttest_indResult(statistic=-1.7457431218879393, pvalue=0.10002508010755197)
'''


#Mannwhitneyu 检验
print(Mannwhitneyu(list_boys,list_girls))
'''
#性别和成绩无显著相关
('Mann-Whitney test', 0.10936655881962447)
there is no significant difference
None
'''


#年龄与得分
list_10=[4,6,8,4,8,9]
list_11=[6,6,9,7,10,13]
list_12=[8,9,13,12,14,16]
list_group=[list_10,list_11,list_12]

print(Kruskawallis_test(list_group))
'''
#年龄与得分有显著相关
Use kruskawallis test:
H value: 7.37853403141
p 0.0249903128375
There is a significant difference.
True
'''

print(stats.f_oneway(list_10,list_11,list_12))
'''
#年龄与得分有显著相关
F_onewayResult(statistic=6.5186915887850461, pvalue=0.0091759991604794412)
'''
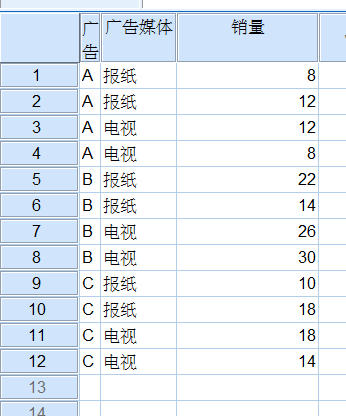
三种广告和两种媒体的双因素方差检验
数据
spss结果
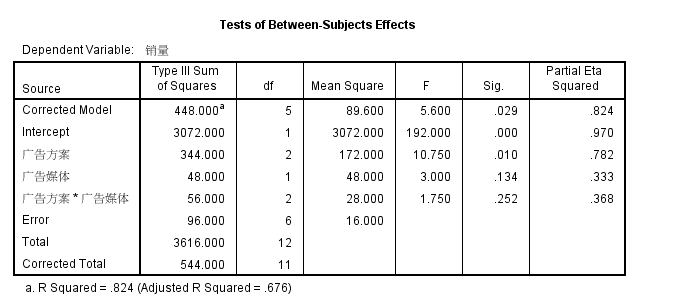
python结果和spss结果一致
广告方案 VS 销量 有显著差异
广告媒体 VS销量 无显著差异
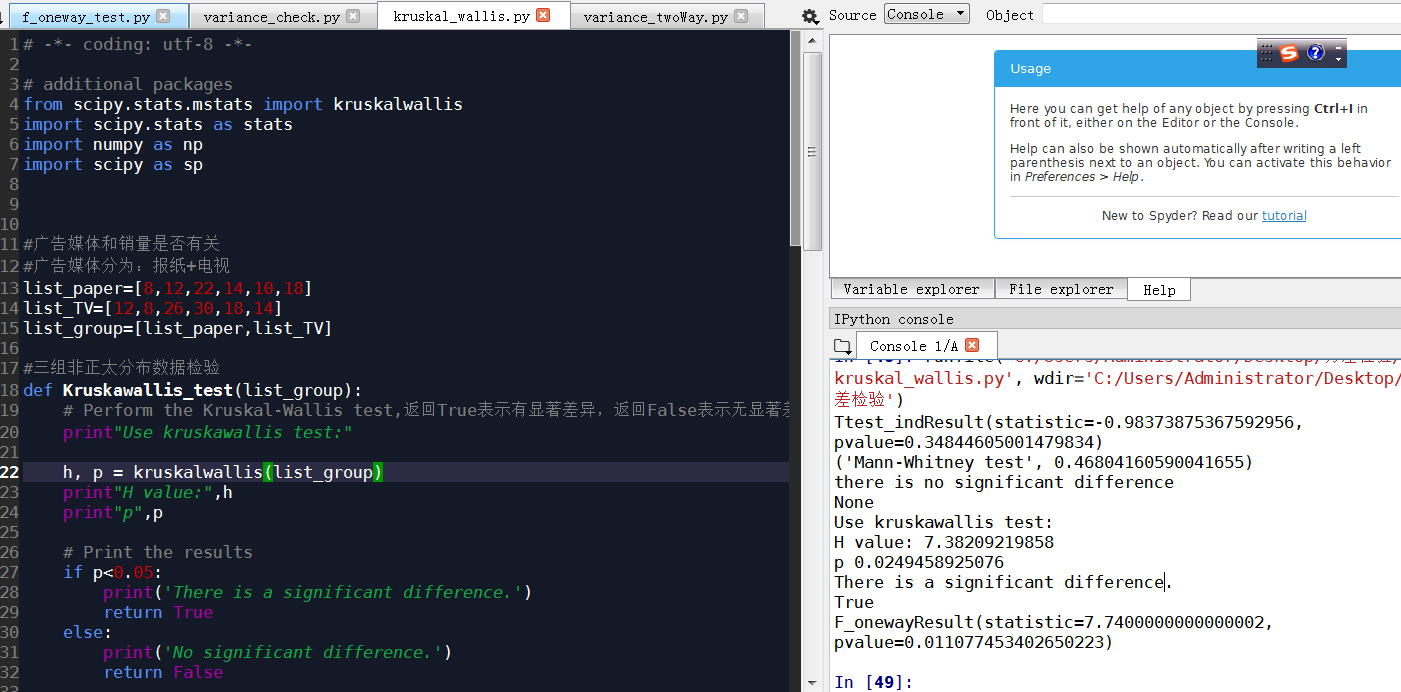
python使用了参数检验和非参数检验
# -*- coding: utf-8 -*-

# additional packages
from scipy.stats.mstats import kruskalwallis
import scipy.stats as stats
import numpy as np
import scipy as sp


#广告媒体和销量是否有关
#广告媒体分为:报纸+电视
list_paper=[8,12,22,14,10,18]
list_TV=[12,8,26,30,18,14]
list_group=[list_paper,list_TV]

#三组非正太分布数据检验
def Kruskawallis_test(list_group):
    # Perform the Kruskal-Wallis test,返回True表示有显著差异,返回False表示无显著差异
    print"Use kruskawallis test:"

    h, p = kruskalwallis(list_group)
    print"H value:",h
    print"p",p

    # Print the results
    if p<0.05:
        print('There is a significant difference.')
        return True
    else:
        print('No significant difference.')
        return False

#两组非正太分布数据检验
def Mannwhitneyu(group1, group2):
    if np.int(sp.__version__.split('.')[1]) > 16:
        u, p_value = stats.mannwhitneyu(group1, group2, alternative='two-sided')
    else:
        u, p_value = stats.mannwhitneyu(group1, group2, use_continuity=True)
        p_value *= 2    # because the default was a one-sided p-value
    print(("Mann-Whitney test", p_value))
    if p_value<0.05:
        print "there is significant difference"
    else:
        print "there is no significant difference"


'''
正态性符合
NormalTest(list_group)
use shapiro:
p of normal: 0.816518545151
data are normal distributed
use shapiro:
p of normal: 0.686249196529
data are normal distributed
Out[44]: True
'''
#独立T检验
print(stats.ttest_ind(list_paper,list_TV))
'''
#广告媒体和销量无显著相关
Out[45]: Ttest_indResult(statistic=-0.98373875367592956, pvalue=0.34844605001479834)
'''
#Mannwhitneyu 检验
print(Mannwhitneyu(list_paper,list_TV))
'''
#广告媒体和销量无显著相关
('Mann-Whitney test', 0.46804160590041655)
there is no significant difference
None
'''


#广告方案与销售量
list_adPlan1=[8,12,12,8]
list_adPlan2=[22,14,26,30]
list_adPlan3=[10,18,18,14]
list_group=[list_adPlan1,list_adPlan2,list_adPlan3]

print(Kruskawallis_test(list_group))
'''
#广告方案与销售量有显著差异
H value: 7.38209219858
p 0.0249458925076
There is a significant difference.
True
'''

print(stats.f_oneway(list_adPlan1,list_adPlan2,list_adPlan3))
'''
#广告方案与销售量有显著差异
F_onewayResult(statistic=7.7400000000000002, pvalue=0.011077453402650223)
'''
超市位置 竞争者数量 销售
数据

分析结果:超市位置,竞争者数量,两者交互都具有显著关系,R**2=0.78,三个因素占了方差差异的78%


python 与spss结果一致
# -*- coding: utf-8 -*-

# additional packages
from scipy.stats.mstats import kruskalwallis
import scipy.stats as stats
import numpy as np
import scipy as sp
import pandas as pd
import variance_check

excel="location_competition_sales.xlsx"
df=pd.read_excel(excel)

#超市位置和销售是否有关
#超市位置分为:居民区+商业区+写字楼
list_resident=list(df.sale[df.location=="resident"])
list_commercial=list(df.sale[df.location=="commercial"])
list_officialBuilding=list(df.sale[df.location=="officialBuilding"])
list_group=[list_resident,list_commercial,list_officialBuilding]


'''
正态分布符合
NormalTest(list_group)
use shapiro:
p of normal: 0.503288388252
data are normal distributed
use shapiro:
p of normal: 0.832764387131
data are normal distributed
use shapiro:
p of normal: 0.516751050949
data are normal distributed
Out[28]: True

方差不齐
scipy.stats.levene(list_resident,list_commercial,list_officialBuilding)
Out[4]: LeveneResult(statistic=4.4442331784870888, pvalue=0.019539858639246118)
'''


#三组非正太分布数据检验
def Kruskawallis_test(list_group):
    # Perform the Kruskal-Wallis test,返回True表示有显著差异,返回False表示无显著差异
    print"Use kruskawallis test:"

    h, p = kruskalwallis(list_group)
    print"H value:",h
    print"p",p

    # Print the results
    if p<0.05:
        print('There is a significant difference.')
        return True
    else:
        print('No significant difference.')
        return False

#两组非正太分布数据检验
def Mannwhitneyu(group1, group2):
    if np.int(sp.__version__.split('.')[1]) > 16:
        u, p_value = stats.mannwhitneyu(group1, group2, alternative='two-sided')
    else:
        u, p_value = stats.mannwhitneyu(group1, group2, use_continuity=True)
        p_value *= 2    # because the default was a one-sided p-value
    print(("Mann-Whitney test", p_value))
    if p_value<0.05:
        print "there is significant difference"
    else:
        print "there is no significant difference"


#超市位置和销售是否有关
print(Kruskawallis_test(list_group))
'''
#超市位置和销售显著相关
H value: 16.5992978614
p 0.000248604089056
There is a significant difference.
Out[5]: True
'''
print(stats.f_oneway(list_resident,list_commercial,list_officialBuilding))
'''
#超市位置和销售显著相关
F_onewayResult(statistic=13.356711543650388, pvalue=5.6272024104779695e-05)
'''

stats.ttest_ind(list_resident,list_commercial)
'''
居民和商业区不限制,LSD方法不准确
Out[13]: Ttest_indResult(statistic=-1.220218599266957, pvalue=0.23530091594463254)
'''
stats.ttest_ind(list_resident,list_officialBuilding)
'''
#居民区和写字楼显著
Out[14]: Ttest_indResult(statistic=3.6229866471434136, pvalue=0.0015056781096067899)
'''
stats.ttest_ind(list_commercial,list_officialBuilding)
'''
#商业区和写字楼显著
Out[15]: Ttest_indResult(statistic=5.9972670824689063, pvalue=4.9044253751230555e-06)
'''


#竞争对手和销售是否有关
list0=list(df.sale[df.competition==0])
list1=list(df.sale[df.competition==1])
list2=list(df.sale[df.competition==2])
list3=list(df.sale[df.competition==3])
list_group1=[list0,list1,list2,list3]

print(Kruskawallis_test(list_group1))
'''
#竞争对手和销售有显著相关
H value: 8.07588250451
p 0.0444692008525
There is a significant difference.
True
'''
print(stats.f_oneway(list0,list1,list2,list3))
'''
#竞争对手和销售有显著相关
F_onewayResult(statistic=4.1350270513392635, pvalue=0.013834155024036648)
'''

stats.ttest_ind(list0,list1)
'''
#竞争对手0和1不显著
Out[18]: Ttest_indResult(statistic=0.28073494601522792, pvalue=0.78251141069039509)
'''
variance_check.py
# -*- coding: utf-8 -*-
'''
用于方差齐性检验
正太性检验
配对相等检验
'''
import scipy,math
from scipy.stats import f
import numpy as np
import matplotlib.pyplot as plt
import scipy.stats as stats
# additional packages
from statsmodels.stats.diagnostic import lillifors
#多重比较
from statsmodels.sandbox.stats.multicomp import multipletests
#用于排列组合
import itertools
'''
#测试数据
group1=[2,3,7,2,6]
group2=[10,8,7,5,10]
group3=[10,13,14,13,15]
list_groups=[group1,group2,group3]
list_total=group1+group2+group3
'''
a=0.05

#正态分布测试
def check_normality(testData):

    #20<样本数<50用normal test算法检验正态分布性
    if 20<len(testData) <50:
       p_value= stats.normaltest(testData)[1]

       if p_value<0.05:
           print"use normaltest"
           print"p of normal:",p_value
           print "data are not normal distributed"
           return  False
       else:
           print"use normaltest"
           print"p of normal:",p_value
           print "data are normal distributed"
           return True

    #样本数小于50用Shapiro-Wilk算法检验正态分布性
    if len(testData) <50:
       p_value= stats.shapiro(testData)[1]
       if p_value<0.05:
           print "use shapiro:"
           print"p of normal:",p_value
           print "data are not normal distributed"
           return  False
       else:
           print "use shapiro:"
           print"p of normal:",p_value
           print "data are normal distributed"
           return True

    if 300>=len(testData) >=50:
       p_value= lillifors(testData)[1]
       if p_value<0.05:
           print "use lillifors:"
           print"p of normal:",p_value
           print "data are not normal distributed"
           return  False
       else:
           print "use lillifors:"
           print"p of normal:",p_value
           print "data are normal distributed"
           return True

    if len(testData) >300:
       p_value= stats.kstest(testData,'norm')[1]
       if p_value<0.05:
           print "use kstest:"
           print"p of normal:",p_value
           print "data are not normal distributed"
           return  False
       else:
           print "use kstest:"
           print"p of normal:",p_value
           print "data are normal distributed"
           return True


#对所有样本组进行正态性检验
def NormalTest(list_groups):
    for group in list_groups:
        #正态性检验
        status=check_normality(group)
        if status==False :
            return False
    return True

#排列组合函数
def Combination(list_groups):
    combination= []
    for i in range(1,len(list_groups)+1):
        iter = itertools.combinations(list_groups,i)
        combination.append(list(iter))
    #需要排除第一个和最后一个
    return combination[1:-1][0]
'''
Out[57]:
[[([2, 3, 7, 2, 6], [10, 8, 7, 5, 10]),
  ([2, 3, 7, 2, 6], [10, 13, 14, 13, 15]),
  ([10, 8, 7, 5, 10], [10, 13, 14, 13, 15])]]
'''


#方差齐性检测
def Levene_test(group1,group2,group3):
    leveneResult=scipy.stats.levene(group1,group2,group3)
    p=leveneResult[1]
    print"levene test:"
    if p<0.05:
        print"variances of groups are not equal"
        return False
    else:
        print"variances of groups are equal"
        return True

'''
H0成立,三组数据方差无显著差异
Out[9]: LeveneResult(statistic=0.24561403508771934, pvalue=0.7860617221429711)
'''

#比较组内的样本是否相等,如果不相等,不适合于tukey等方法
#此函数有问题,无法解决nan排除
def Equal_lenth(list_groups):
    list1=list_groups[0]
    list2=list_groups[1]
    list3=list_groups[2]

    list1_removeNan=[x for x in list1 if str(x) != 'nan' and str(x)!= '-inf']
    list2_removeNan=[x for x in list2 if str(x) != 'nan' and str(x)!= '-inf']
    list3_removeNan=[x for x in list3 if str(x) != 'nan' and str(x)!= '-inf']

    len1=len(list1_removeNan)
    len2=len(list2_removeNan)
    len3=len(list3_removeNan)
    if len1==len2==len3:
        return True
    else:
        return False


'''
#返回True or false
normality=NormalTest(list_groups)
leveneResult=Levene_test(list_groups[0],list_groups[1],list_groups[2])
'''
https://study.163.com/provider/400000000398149/index.htm?share=2&shareId=400000000398149( 欢迎关注博主主页,学习python视频资源,还有大量免费python经典文章)
