python机器学习-乳腺癌细胞挖掘(欢迎关注博主主页,学习python视频资源,还有大量免费python经典文章)

项目合作QQ:231469242
Tukey等多重检验容易报错,数据结构不一致
TypeError: Cannot cast array data from dtype('S11') to dtype('float64') according to the rule 'safe'
来源
英国统计家Fisher为解释实验数据而首先引入
方差分析VS t检验
方差分析的H0:所有样本的平均数相等,如果H1成了,我们只知道他们(样本平均数)不一样
The null hypothesis in a one-way ANOVA is that the means of all the samples are
the same. So if a one-way ANOVA yields a significant result, we only know that
they are not the same.
当因素较多,用t做两两比较时,第一型错误概率都是a,多次重复检验会使一型错误概略相应增加,检验完时,犯一型错误概率大于a。同时,随着检验次数的增加,偶然因素导致差别的可能性也会增加。方差分析就很容易解决此问题,它同时考虑所有样本数据,一次检验即可判断多个总体的均值是否相同,这不仅排除了犯错误的累积概率,也提高了检验效率。
总体分析过程

术语
方差分析(analysis of variance):缩写为ANOVA,分析分类自变量对数值因变量影响的一种统计方法。
单因素方差分析(one-way analsis of variance):研究一个分类自变量对数值因变量影响的方差分析。
双因素方差分析(two-hway analysis of variance):研究两个自变量对数值因变量影响的方差分析。它分为只考虑主效应的双因素方差分析和考虑交互效应的双因素方差分析。
因素(factor):检验的对象,既自变量
处理(treatment):也称水平,因素不同的取值
处理误差(treatment error):因素的不同处理造成观测数据的误差
总平方和(sum of squares for total):SST,反应全部观测数据误差大小的平方和
处理平方和(treatment sum of squares):SSA,反应处理误差大小的平方和
误差平方和(sum of squares of error):SSE,反应随机误差大小的平方和,也称组内平方和(within-group sum of squares)
均方(mean square):也称方差(variance),数据误差大小的平方和除以相应的自由度的结果,记为MS
主效应(main effect):因素对因变量的单独影响。
交互效应(interaction):一个因素和另一个因素联合产生的对因变量的附加效应。
可重复双因素分析(two-factor with replication):考虑交互性
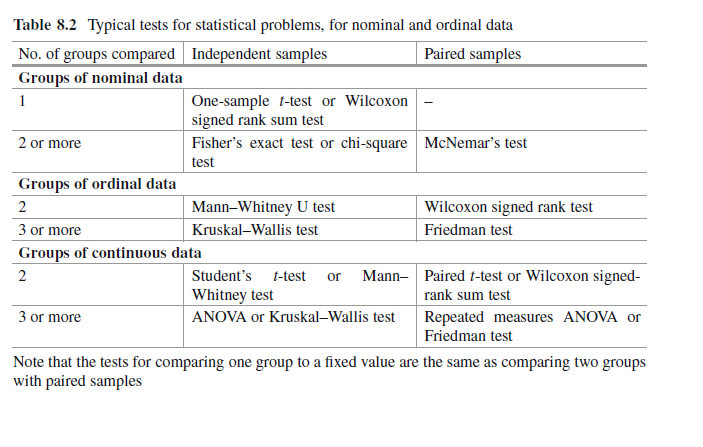
multiple test 多重比较:用于分析哪些处理之间有显著差异,即具体水平的分析,就是找哪两个均值不相等,多重比较方法多,Fisher提出最小差异显著least significant difference,LSD,测试结果LSD不准确。如果数据来自同一样本,用配对T实验两两比较,如果数据来自不同样本,用独立T实验两两比较。
也可用综合法。
post-hoc analysis:事后分析; 因果分析
方差分析的基本假定:
1.正态性
每种处理的总体都应服从正态分布
2.方差齐性homogeneity variance
各个总体的方差必须相等
3.独立性 independence
每个样本数据都来自不同处理的独立样本。
方差分析对独立性要求高,若独立性得不到满足,方差分析结构往往受到较大影响。
对正态性和方差齐性要求比较宽松,当正态性得不到满足和方差略有不齐时,对影响不是很大。
单因素方差分析
数据来源
https://github.com/thomas-haslwanter/statsintro_python/tree/master/ISP/Code_Quantlets/08_TestsMeanValues/anovaOneway


# -*- coding: utf-8 -*-
'''
Name of QuantLet: ISP_anovaOneway

Published in:  An Introduction to Statistics with Python

Description: 'Analysis of Variance (ANOVA)
    - Levene test
    - ANOVA - oneway
    - Do a simple one-way ANOVA, using statsmodels
    - Show how the ANOVA can be done by hand.
    - For the comparison of two groups, a one-way ANOVA is equivalent to
      a T-test: t^2 = F'

Keywords: anova, levene test, one-way anova, t-test

See also: 'ISP_anovaTwoway, ISP_kruskalWallis,
    ISP_multipleTesting, ISP_oneGroup, ISP_twoGroups'

Author: Thomas Haslwanter

Submitted: October 31, 2015

Datafile:  altman_910.txt, galton.csv

Example: anova_annotated.png


Analysis of Variance (ANOVA)
- Levene test
- ANOVA - oneway
- Do a simple one-way ANOVA, using statsmodels
- Show how the ANOVA can be done by hand.
- For the comparison of two groups, a one-way ANOVA is equivalent to
  a T-test: t^2 = F
'''

# Import standard packages
import numpy as np
import scipy.stats as stats
import pandas as pd

# additional packages
from statsmodels.formula.api import ols
#ANOVA table for one or more fitted linear models.
#anova_lm用于一个或多个因素的方差分析,analysis of variance_linear models
from statsmodels.stats.anova import anova_lm


#单因素方差检验,比较scipy.stats和statsmodels结果是否一致
def anova_oneway():
    ''' One-way ANOVA: test if results from 3 groups are equal.

    Twenty-two patients undergoing cardiac bypass surgery were randomized to one of three ventilation groups:

    Group I: Patients received 50% nitrous oxide and 50% oxygen mixture continuously for 24 h.
    Group II: Patients received a 50% nitrous oxide and 50% oxygen mixture only dirng the operation.
    Group III: Patients received no nitrous oxide but received 35-50% oxygen for 24 h.

    The data show red cell folate levels for the three groups after 24h' ventilation.

    '''

    # Get the data
    print('One-way ANOVA: -----------------')
    inFile = 'altman_910.txt'
    data = np.genfromtxt(inFile, delimiter=',')

    # Sort them into groups, according to column 1
    group1 = data[data[:,1]==1,0]
    group2 = data[data[:,1]==2,0]
    group3 = data[data[:,1]==3,0]

    # --- >>> START stats <<< ---
    # First, check if the variances are equal, with the "Levene"-test
    (W,p) = stats.levene(group1, group2, group3)
    if p<0.05:
        print(('Warning: the p-value of the Levene test is <0.05: p={0}'.format(p)))

    # Do the one-way ANOVA
    F_statistic, pVal = stats.f_oneway(group1, group2, group3)
    # --- >>> STOP stats <<< ---

    # Print the results
    print('Data form Altman 910:')
    print((F_statistic, pVal))
    if pVal < 0.05:
        print('One of the groups is significantly different.')

    # Elegant alternative implementation, with pandas & statsmodels
    df = pd.DataFrame(data, columns=['value', 'treatment'])
    #如果没有大写C(),会出错,因为表示分类变量,category
    model = ols('value ~ C(treatment)', df).fit()
    anovaResults = anova_lm(model)
    print(anovaResults)

    # Check if the two results are equal. If they are, there is no output
    #decimal=3表示精确到的小数位。如果两个数相等,结果为空,否则出现异常提示
    np.testing.assert_almost_equal(F_statistic, anovaResults['F'][0],decimal=3)

    return (F_statistic, pVal) # should be (3.711335988266943, 0.043589334959179327)


#----------------------------------------------------------------------
#两组数对比时,检查独立T检验和F检验是否一致
def show_teqf():
    """Shows the equivalence of t-test and f-test, for comparing two groups"""

    # Get the data
    data = pd.read_csv('galton.csv')

    # First, calculate the F- and the T-values, ...
    F_statistic, pVal = stats.f_oneway(data['father'], data['mother'])
    t_val, pVal_t = stats.ttest_ind(data['father'], data['mother'])

    # ... and show that t**2 = F
    print('
T^2 == F: ------------------------------------------')
    print(('From the t-test we get t^2={0:5.3f}, and from the F-test F={1:5.3f}'.format(t_val**2, F_statistic)))

    # numeric test
    np.testing.assert_almost_equal(t_val**2, F_statistic,decimal=3)

    return F_statistic


# ---------------------------------------------------------------
def anova_statsmodels():
    ''' do the ANOVA with a function '''

    # Get the data
    data = pd.read_csv('galton.csv')
    #sex是性别,属于分类变量,C(sex)表示把sex作为分类变量处理,C为category缩写
    anova_results = anova_lm(ols('height~C(sex)', data).fit())
    print('
ANOVA with "statsmodels" ------------------------------')
    print(anova_results)

    return anova_results['F'][0]


#----------------------------------------------------------------------
#方差分析手动建模
def anova_byHand():
    """ Calculate the ANOVA by hand. While you would normally not do that, this function shows
    how the underlying values can be calculated.
    """

     # Get the data
    inFile = 'altman_910.txt'
    data = np.genfromtxt(inFile, delimiter=',')

    # Convert them to pandas-forman and group them by their group value
    df = pd.DataFrame(data, columns=['values', 'group'])
    groups = df.groupby('group')

    # The "total sum-square" is the squared deviation from the mean
    ss_total = np.sum((df['values']-df['values'].mean())**2)

    # Calculate ss_treatment and  ss_error
    (ss_treatments, ss_error) = (0, 0)
    for val, group in groups:
        ss_error += sum((group['values'] - group['values'].mean())**2)
        ss_treatments += len(group) * (group['values'].mean() - df['values'].mean())**2

    df_groups = len(groups)-1
    df_residuals = len(data)-len(groups)
    F = (ss_treatments/df_groups) / (ss_error/df_residuals)
    df = stats.f(df_groups,df_residuals)
    p = df.sf(F)

    print(('ANOVA-Results: F = {0}, and p<{1}'.format(F, p)))

    return (F, p)


if __name__ == '__main__':
    anova_oneway()
    anova_byHand()
    show_teqf()
    anova_statsmodels()
    raw_input('Done!')
单尾方差分析模型:增加了多重分析

# -*- coding: utf-8 -*-
import scipy,math
from scipy.stats import f
import numpy as np
import matplotlib.pyplot as plt
import scipy.stats as stats
# additional packages
from statsmodels.stats.diagnostic import lillifors
#多重比较
from statsmodels.sandbox.stats.multicomp import multipletests
#用于排列组合
import itertools

group1=[2,3,7,2,6]
group2=[10,8,7,5,10]
group3=[10,13,14,13,15]
'''
group1=[2,2,3,4,4,5,3,4,4,4]
group2=[4,4,3,5,4,1,1,2,3,3]
group3=[1,2,2,2,3,2,3,1,3,1]

'''
list_groups=[group1,group2,group3]
list_total=group1+group2+group3
a=0.05

#one within group error,also know as random error
def SE(group):
    se=0
    mean1=np.mean(group)
    for i in group:
        error=i-mean1
        se+=error**2
    return se

'''
>>> SE(group1)
22.0
>>> SE(group2)
18.0
>>> SE(group3)
14.0
'''
#sum of squares within group error,also know as random error
def SSE(list_groups):
    sse=0
    for group in list_groups:
        se=SE(group)
        sse+=se
    return sse


#误差总平方和
def SST(list_total):
    sst=0
    mean1=np.mean(list_total)
    for i in list_total:
        error=i-mean1
        sst+=error**2
    return sst


#SSA,between-group sum of squares 组间平方和,公式1:ssa=sst-sse
def SSA(list_groups,list_total):
    sse=SSE(list_groups)
    sst=SST(list_total)
    ssa=sst-sse
    return ssa


#SSA,between-group sum of squares 组间平方和
def SSA1(list_groups,list_total):
    mean_total=np.mean(list_total)
    ssa=0
    for group in list_groups:
        group_mean=np.mean(group)
        distance=(mean_total-group_mean)**2
        ssa+=distance

    ssa=ssa*5
    return ssa

#处理效应均方
def MSA(list_groups,list_total):
    ssa=SSA(list_groups,list_total)
    msa=ssa/(len(list_groups)-1)*1.0
    return msa

# 误差均方
def MSE(list_groups,list_total):
    sse=SSE(list_groups)
    mse=sse/(len(list_total)-1*len(list_groups))*1.0
    return mse

#F score
def F(list_groups,list_total):
    msa=MSA(list_groups,list_total)
    mse=MSE(list_groups,list_total)
    ratio=msa/mse*1.0
    return ratio
'''
>>> F(list_groups,list_total)
22.592592592592595
'''

#LSD(least significant difference)最小显著差异
def LSD(list_groups,list_total,sample1,sample2):
    mean1=np.mean(sample1)
    mean2=np.mean(sample2)
    distance=abs(mean1-mean2)
    print"distance:",distance
    #t检验的自由度
    df=len(list_total)-1*len(list_groups)
    mse=MSE(list_groups,list_total)
    print"MSE:",mse
    t_value=stats.t(df).isf(a/2)
    print"t value:",t_value
    lsd=t_value*math.sqrt(mse*(1.0/len(sample1)+1.0/len(sample2)))
    print "LSD:",lsd
    if distance<lsd:
        print"no significant difference between:",sample1,sample2
    else:
        print"there is significant difference between:",sample1,sample2


#正态分布测试
def check_normality(testData):

    #20<样本数<50用normal test算法检验正态分布性
    if 20<len(testData) <50:
       p_value= stats.normaltest(testData)[1]
       if p_value<0.05:
           print"use normaltest"
           print "data are not normal distributed"
           return  False
       else:
           print"use normaltest"
           print "data are normal distributed"
           return True

    #样本数小于50用Shapiro-Wilk算法检验正态分布性
    if len(testData) <50:
       p_value= stats.shapiro(testData)[1]
       if p_value<0.05:
           print "use shapiro:"
           print "data are not normal distributed"
           return  False
       else:
           print "use shapiro:"
           print "data are normal distributed"
           return True

    if 300>=len(testData) >=50:
       p_value= lillifors(testData)[1]
       if p_value<0.05:
           print "use lillifors:"
           print "data are not normal distributed"
           return  False
       else:
           print "use lillifors:"
           print "data are normal distributed"
           return True

    if len(testData) >300:
       p_value= stats.kstest(testData,'norm')[1]
       if p_value<0.05:
           print "use kstest:"
           print "data are not normal distributed"
           return  False
       else:
           print "use kstest:"
           print "data are normal distributed"
           return True


#对所有样本组进行正态性检验
def NormalTest(list_groups):
    for group in list_groups:
        #正态性检验
        status=check_normality(group)
        if status==False :
            return False

#排列组合函数
def Combination(list_groups):
    combination= []
    for i in range(1,len(list_groups)+1):
        iter = itertools.combinations(list_groups,i)
        combination.append(list(iter))
    #需要排除第一个和最后一个
    return combination[1:-1][0]
'''
Out[57]:
[[([2, 3, 7, 2, 6], [10, 8, 7, 5, 10]),
  ([2, 3, 7, 2, 6], [10, 13, 14, 13, 15]),
  ([10, 8, 7, 5, 10], [10, 13, 14, 13, 15])]]
'''

#多重比较
def Multiple_test(list_groups):
    print"multiple test----------------------------------------------"
    combination=Combination(list_groups)
    for pair in combination:
        LSD(list_groups,list_total,pair[0],pair[1])


#对所有样本组进行正态性检验
print"M=Normality test:-----------------------------------"
NormalTest(list_groups)

#方差齐性检测
scipy.stats.levene(group1,group2,group3)
'''
H0成立,三组数据方差无显著差异
Out[9]: LeveneResult(statistic=0.24561403508771934, pvalue=0.7860617221429711)
'''

print "result--------------------------------------------------"
f_score=F(list_groups,list_total)
print"F score:",f_score
#sf 为生存函数survival function
probability=f.sf(f_score,2,12)
'''
Out[28]: 8.5385924542746692e-05
'''
if probability<0.05:
    print"there is significance,H1 win"

#多重比较
print"Multiple test",Multiple_test
Multiple_test(list_groups)
多重分析综合版本
https://github.com/thomas-haslwanter/statsintro_python/tree/master/ISP/Code_Quantlets/08_TestsMeanValues/multipleTesting
Name of QuantLet: ISP_multipleTesting
Published in: An Introduction to Statistics with Python
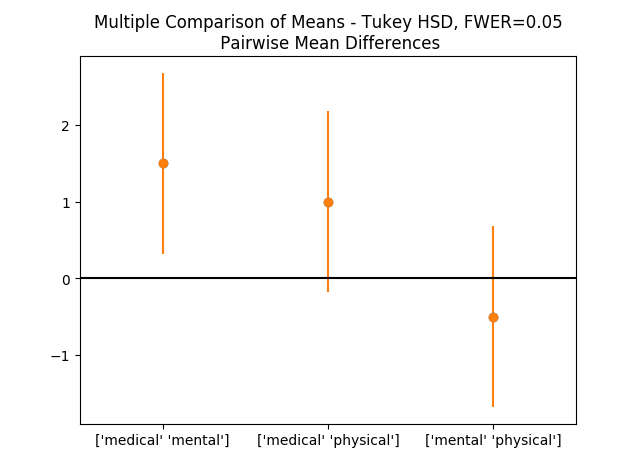
Description: 'Multiple testing
This script provides an example, where three treatments are compared. It
first performs a one-way ANOVA, to see if there is a difference between the
groups. Then it performs multiple comparisons, to check which of the groups
are different.
This dataset is taken from an R-tutorial, and contains a hypothetical sample
of 30 participants who are divided into three stress reduction treatment
groups (mental, physical, and medical). The values are represented on a
scale that ranges from 1 to 5. This dataset can be conceptualized as a
comparison between three stress treatment programs, one using mental
methods, one using physical training, and one using medication. The values
represent how effective the treatment programs were at reducing
participant''s stress levels, with higher numbers indicating higher
effectiveness.
Taken from an example by Josef Perktold (http://jpktd.blogspot.co.at/)'
Keywords: 'post hoc test, anova, tukey''s HSD test, Holm test'
See also: 'ISP_anovaOneway, ISP_anovaTwoway, ISP_kruskalWallis,
ISP_oneGroup, ISP_twoGroups'
Author: Thomas Haslwanter
Submitted: October 31, 2015
Example: multComp.png

# -*- coding: utf-8 -*-

# Import standard packages
import numpy as np
import matplotlib.pyplot as plt
from scipy import stats
import pandas as pd
import os

# additional packages
import sys
sys.path.append(os.path.join('..', '..', 'Utilities'))

try:
# Import formatting commands if directory "Utilities" is available
    from ISP_mystyle import showData

except ImportError:
# Ensure correct performance otherwise
    def showData(*options):
        plt.show()
        return

# Other required packages
from statsmodels.stats.multicomp import (pairwise_tukeyhsd,
                                         MultiComparison)
from statsmodels.formula.api import ols
from statsmodels.stats.anova import anova_lm
from statsmodels.stats.libqsturng import psturng
import variance_check

#数据excel名
excel="sample.xlsx"
#读取数据
df=pd.read_excel(excel)
#获取第一组数据,结构为列表
group_mental=list(df.StressReduction[(df.Treatment=="mental")])
group_physical=list(df.StressReduction[(df.Treatment=="physical")])
group_medical=list(df.StressReduction[(df.Treatment=="medical")])

#数据预处理
groupMental_removeNan=[x for x in group_mental if str(x) != 'nan' and str(x)!= '-inf']
groupPhysical_removeNan=[x for x in group_physical if str(x) != 'nan' and str(x)!= '-inf']
groupMedical_removeNan=[x for x in group_medical if str(x) != 'nan' and str(x)!= '-inf']

list_groups=[groupMental_removeNan,groupPhysical_removeNan,groupMedical_removeNan]
list_total=groupMental_removeNan+groupPhysical_removeNan+groupMedical_removeNan
#前期检验
normality=variance_check.NormalTest(list_groups)
leveneResult=variance_check.Levene_test(list_groups[0],list_groups[1],list_groups[2])
equal_lenth=variance_check.Equal_lenth(list_groups)


#如果每组样本数量不一致,会异常出错,需要数据预处理
def doAnova(df):
    #one-way ANOVA
    model = ols('StressReduction ~ C(Treatment)',df).fit()
    #如果每组样本数量不一致,会异常出错
    anovaResults =  anova_lm(model)
    print(anovaResults)
    if anovaResults['PR(>F)'][0] < 0.05:
        print('One of the groups is different.')


def doTukey(data, multiComp,equal_lenth):
    '''Do a pairwise comparison, and show the confidence intervals'''
    if equal_lenth==False:
        print"warning:the length of groups are not equal"
        return False


    print((multiComp.tukeyhsd().summary()))

    # Calculate the p-values:
    res2 = pairwise_tukeyhsd(data['StressReduction'], data['Treatment'])

    #下面代码是绘图
    df = pd.DataFrame(data)
    numData = len(df)
    numTreatments = len(df.Treatment.unique())
    dof = numData - numTreatments

    # Show the group names
    print((multiComp.groupsunique))

    # Generate a print -------------------

    # Get the data
    xvals = np.arange(3)
    res2 = pairwise_tukeyhsd(data['StressReduction'], data['Treatment'])
    errors = np.ravel(np.diff(res2.confint)/2)

    # Plot them
    plt.plot(xvals, res2.meandiffs, 'o')
    plt.errorbar(xvals, res2.meandiffs, yerr=errors, fmt='o')

    # Put on labels
    pair_labels = multiComp.groupsunique[np.column_stack(res2._multicomp.pairindices)]
    plt.xticks(xvals, pair_labels)

    # Format the plot
    xlim = -0.5, 2.5
    plt.hlines(0, *xlim)
    plt.xlim(*xlim)
    plt.title('Multiple Comparison of Means - Tukey HSD, FWER=0.05' +
              '
 Pairwise Mean Differences')

    # Save to outfile, and show the data
    outFile = 'multComp.png'
    showData(outFile)

def Holm_Bonferroni(multiComp):
    ''' Instead of the Tukey's test, we can do pairwise t-test
    通过均分a=0.05,矫正a,得到更小a'''

    # First, with the "Holm" correction
    rtp = multiComp.allpairtest(stats.ttest_rel, method='Holm')
    print((rtp[0]))

    # and then with the Bonferroni correction
    print((multiComp.allpairtest(stats.ttest_rel, method='b')[0]))

    # Any value, for testing the program for correct execution
    checkVal = rtp[1][0][0,0]
    return checkVal


#正态分布测试
def check_normality(testData):

    #20<样本数<50用normal test算法检验正态分布性
    if 20<len(testData) <50:
       p_value= stats.normaltest(testData)[1]
       if p_value<0.05:
           print"use normaltest"
           print "data are not normal distributed"
           return  False
       else:
           print"use normaltest"
           print "data are normal distributed"
           return True

    #样本数小于50用Shapiro-Wilk算法检验正态分布性
    if len(testData) <50:
       p_value= stats.shapiro(testData)[1]
       if p_value<0.05:
           print "use shapiro:"
           print "data are not normal distributed"
           return  False
       else:
           print "use shapiro:"
           print "data are normal distributed"
           return True

    if 300>=len(testData) >=50:
       p_value= lillifors(testData)[1]
       if p_value<0.05:
           print "use lillifors:"
           print "data are not normal distributed"
           return  False
       else:
           print "use lillifors:"
           print "data are normal distributed"
           return True

    if len(testData) >300:
       p_value= stats.kstest(testData,'norm')[1]
       if p_value<0.05:
           print "use kstest:"
           print "data are not normal distributed"
           return  False
       else:
           print "use kstest:"
           print "data are normal distributed"
           return True


#对所有样本组进行正态性检验
def NormalTest(list_groups):
    for group in list_groups:
        #正态性检验
        status=check_normality(group1)
        if status==False :
            return False

def main():
    # Do a one-way ANOVA单因素方差
    #此函数有问题,需要纠正
    doAnova(df)
    #stats.f_oneway(groupMental_removeNan,groupPhysical_removeNan,groupMedical_removeNan)
    #Then, do the multiple testing
    multiComp = MultiComparison(df['StressReduction'], df['Treatment'])

    doTukey(df, multiComp,equal_lenth)    # Tukey's HSD test
    checkVal = Holm_Bonferroni(multiComp)  # Alternatives to Tukey's HSD test

    return checkVal     # this is only for regression testing of the program

if __name__ == '__main__':
    main()
variance_check.py
# -*- coding: utf-8 -*-
'''
用于方差齐性检验
正太性检验
配对相等检验
'''
import scipy,math
from scipy.stats import f
import numpy as np
import matplotlib.pyplot as plt
import scipy.stats as stats
# additional packages
from statsmodels.stats.diagnostic import lillifors
#多重比较
from statsmodels.sandbox.stats.multicomp import multipletests
#用于排列组合
import itertools
'''
#测试数据
group1=[2,3,7,2,6]
group2=[10,8,7,5,10]
group3=[10,13,14,13,15]
list_groups=[group1,group2,group3]
list_total=group1+group2+group3
'''
a=0.05

#正态分布测试
def check_normality(testData):

    #20<样本数<50用normal test算法检验正态分布性
    if 20<len(testData) <50:
       p_value= stats.normaltest(testData)[1]
       if p_value<0.05:
           print"use normaltest"
           print "data are not normal distributed"
           return  False
       else:
           print"use normaltest"
           print "data are normal distributed"
           return True

    #样本数小于50用Shapiro-Wilk算法检验正态分布性
    if len(testData) <50:
       p_value= stats.shapiro(testData)[1]
       if p_value<0.05:
           print "use shapiro:"
           print "data are not normal distributed"
           return  False
       else:
           print "use shapiro:"
           print "data are normal distributed"
           return True

    if 300>=len(testData) >=50:
       p_value= lillifors(testData)[1]
       if p_value<0.05:
           print "use lillifors:"
           print "data are not normal distributed"
           return  False
       else:
           print "use lillifors:"
           print "data are normal distributed"
           return True

    if len(testData) >300:
       p_value= stats.kstest(testData,'norm')[1]
       if p_value<0.05:
           print "use kstest:"
           print "data are not normal distributed"
           return  False
       else:
           print "use kstest:"
           print "data are normal distributed"
           return True


#对所有样本组进行正态性检验
def NormalTest(list_groups):
    for group in list_groups:
        #正态性检验
        status=check_normality(group)
        if status==False :
            return False
    return True

#排列组合函数
def Combination(list_groups):
    combination= []
    for i in range(1,len(list_groups)+1):
        iter = itertools.combinations(list_groups,i)
        combination.append(list(iter))
    #需要排除第一个和最后一个
    return combination[1:-1][0]
'''
Out[57]:
[[([2, 3, 7, 2, 6], [10, 8, 7, 5, 10]),
  ([2, 3, 7, 2, 6], [10, 13, 14, 13, 15]),
  ([10, 8, 7, 5, 10], [10, 13, 14, 13, 15])]]
'''


#方差齐性检测
def Levene_test(group1,group2,group3):
    leveneResult=scipy.stats.levene(group1,group2,group3)
    p=leveneResult[1]
    print"levene test:"
    if p<0.05:
        print"variances of groups are not equal"
        return False
    else:
        print"variances of groups are equal"
        return True

'''
H0成立,三组数据方差无显著差异
Out[9]: LeveneResult(statistic=0.24561403508771934, pvalue=0.7860617221429711)
'''

#比较组内的样本是否相等,如果不相等,不适合于tukey等方法
#此函数有问题,无法解决nan排除
def Equal_lenth(list_groups):
    list1=list_groups[0]
    list2=list_groups[1]
    list3=list_groups[2]

    list1_removeNan=[x for x in list1 if str(x) != 'nan' and str(x)!= '-inf']
    list2_removeNan=[x for x in list2 if str(x) != 'nan' and str(x)!= '-inf']
    list3_removeNan=[x for x in list3 if str(x) != 'nan' and str(x)!= '-inf']

    len1=len(list1_removeNan)
    len2=len(list2_removeNan)
    len3=len(list3_removeNan)
    if len1==len2==len3:
        return True
    else:
        return False


'''
#返回True or false
normality=NormalTest(list_groups)
leveneResult=Levene_test(list_groups[0],list_groups[1],list_groups[2])
'''
levene test
顾名思义,就是检验两者方差是不是齐性的(齐性,就是一致的),保证两者是来自同一个整体
http://www.itl.nist.gov/div898/handbook/eda/section3/eda35a.htm
https://docs.scipy.org/doc/scipy/reference/generated/scipy.stats.levene.html
levene test 用于测试所有输入样本是否来自相同方差的总体。

# -*- coding: utf-8 -*-
import scipy
from scipy.stats import f
import numpy as np

group1=[2,3,7,2,6]
group2=[10,8,7,5,10]
group3=[10,13,14,13,15]


#方差齐性检测
scipy.stats.levene(group1,group2,group3)
'''
H0成立,三组数据方差无显著差异
Out[9]: LeveneResult(statistic=0.24561403508771934, pvalue=0.7860617221429711)
'''

源代码
def levene(*args, **kwds):
    """
    Perform Levene test for equal variances.
    The Levene test tests the null hypothesis that all input samples
    are from populations with equal variances.  Levene's test is an
    alternative to Bartlett's test `bartlett` in the case where
    there are significant deviations from normality.
    Parameters
    ----------
    sample1, sample2, ... : array_like
        The sample data, possibly with different lengths
    center : {'mean', 'median', 'trimmed'}, optional
        Which function of the data to use in the test.  The default
        is 'median'.
    proportiontocut : float, optional
        When `center` is 'trimmed', this gives the proportion of data points
        to cut from each end. (See `scipy.stats.trim_mean`.)
        Default is 0.05.
    Returns
    -------
    statistic : float
        The test statistic.
    pvalue : float
        The p-value for the test.
    Notes
    -----
    Three variations of Levene's test are possible.  The possibilities
    and their recommended usages are:
      * 'median' : Recommended for skewed (non-normal) distributions>
      * 'mean' : Recommended for symmetric, moderate-tailed distributions.
      * 'trimmed' : Recommended for heavy-tailed distributions.
    References
    ----------
    .. [1]  http://www.itl.nist.gov/div898/handbook/eda/section3/eda35a.htm
    .. [2]   Levene, H. (1960). In Contributions to Probability and Statistics:
               Essays in Honor of Harold Hotelling, I. Olkin et al. eds.,
               Stanford University Press, pp. 278-292.
    .. [3]  Brown, M. B. and Forsythe, A. B. (1974), Journal of the American
              Statistical Association, 69, 364-367
    """
    # Handle keyword arguments.
    center = 'median'
    proportiontocut = 0.05
    for kw, value in kwds.items():
        if kw not in ['center', 'proportiontocut']:
            raise TypeError("levene() got an unexpected keyword "
                            "argument '%s'" % kw)
        if kw == 'center':
            center = value
        else:
            proportiontocut = value

    k = len(args)
    if k < 2:
        raise ValueError("Must enter at least two input sample vectors.")
    Ni = zeros(k)
    Yci = zeros(k, 'd')

    if center not in ['mean', 'median', 'trimmed']:
        raise ValueError("Keyword argument <center> must be 'mean', 'median'"
                        " or 'trimmed'.")

    if center == 'median':
        func = lambda x: np.median(x, axis=0)
    elif center == 'mean':
        func = lambda x: np.mean(x, axis=0)
    else:  # center == 'trimmed'
        args = tuple(stats.trimboth(np.sort(arg), proportiontocut)
                     for arg in args)
        func = lambda x: np.mean(x, axis=0)

    for j in range(k):
        Ni[j] = len(args[j])
        Yci[j] = func(args[j])
    Ntot = np.sum(Ni, axis=0)

    # compute Zij's
    Zij = [None] * k
    for i in range(k):
        Zij[i] = abs(asarray(args[i]) - Yci[i])

    # compute Zbari
    Zbari = zeros(k, 'd')
    Zbar = 0.0
    for i in range(k):
        Zbari[i] = np.mean(Zij[i], axis=0)
        Zbar += Zbari[i] * Ni[i]

    Zbar /= Ntot
    numer = (Ntot - k) * np.sum(Ni * (Zbari - Zbar)**2, axis=0)

    # compute denom_variance
    dvar = 0.0
    for i in range(k):
        dvar += np.sum((Zij[i] - Zbari[i])**2, axis=0)

    denom = (k - 1.0) * dvar

    W = numer / denom
    pval = distributions.f.sf(W, k-1, Ntot-k)  # 1 - cdf
    return LeveneResult(W, pval)


双因素方差分析
# -*- coding: utf-8 -*-
'''
Name of QuantLet: ISP_anovaTwoway

Published in:  An Introduction to Statistics with Python

Description: 'Two-way Analysis of Variance (ANOVA)
    The model is formulated using the <patsy> formula description. This is very
    similar to the way models are expressed in R.'

Keywords: plot, fitting, two-way anova

See also: 'ISP_anovaOneway, ISP_kruskalWallis,
    ISP_multipleTesting, ISP_oneGroup, ISP_twoGroups'

Author: Thomas Haslwanter

Submitted: October 31, 2015

Datafile: altman_12_6.txt

Two-way Analysis of Variance (ANOVA)
The model is formulated using the "patsy" formula description. This is very
similar to the way models are expressed in R.
'''

# Copyright(c) 2015, Thomas Haslwanter. All rights reserved, under the CC BY-SA 4.0 International License

# Import standard packages
import numpy as np
import pandas as pd

# additional packages
from statsmodels.formula.api import ols
from statsmodels.stats.anova import anova_lm

inFile = 'altman_12_6.txt'


def anova_interaction(inFile):
    '''ANOVA with interaction: Measurement of fetal head circumference,
    by four observers in three fetuses, from a study investigating the
    reproducibility of ultrasonic fetal head circumference data.
    '''

    # Get the data

    data = np.genfromtxt(inFile, delimiter=',')

    # Bring them in DataFrame-format
    df = pd.DataFrame(data, columns=['hs', 'fetus', 'observer'])

    # --- >>> START stats <<< ---
    # Determine the ANOVA with interaction
    formula = 'hs ~ C(fetus) + C(observer) + C(fetus):C(observer)'
    lm = ols(formula, df).fit()
    anovaResults = anova_lm(lm)
    # --- >>> STOP stats <<< ---
    print(anovaResults)

    return  anovaResults['F'][0]

if __name__ == '__main__':
    anova_interaction(inFile)
In words: While—as expected—different fetuses show highly significant differences
in their head size (p < 0:001), also the choice of the observer has a significant
effect (p < 0:05). However, no individual observer was significantly off with any
individual fetus (p > 0:05).
数据源
https://github.com/thomas-haslwanter/statsintro_python/blob/master/ISP/Code_Quantlets/08_TestsMeanValues/anovaTwoway/altman_12_6.txt


SPSS 如何进行方差分析
数据是3组的计量数据,那么我们需要对数据进行正态性和方差齐性的检验,正态性检验与前面介绍的相同,而方差齐性这里有些小小的区别,下面详细说明具体步骤
-
第一步:将数据录入到SPSS的数据视图中,这一步与前面t检验相同,输入数据后,选择【分析】→【比较均值】→【单因素ANOVA】

-
第二步:点击后,出现下图的单因素方差分析的窗口,将【value】→【因子】,【group】→【因变量列表】

-
第三步:点击【选项】出现线面单因素ANOVA的窗口,其中勾选【方差同质性检验】后,点击【继续】,
确定后,即可在结果中看到方差齐性的结果,

 END
END
方法/步骤2
第四步:结果,如下图所示,我们看到Levene检验的结果,知显著性为0.382,即P>0.05,差异无统计学意义,表示方差齐,


Multiple Comparisons
多重比较:用于分析哪些处理之间有显著差异,即具体水平的分析,就是找哪两个均值不相等,多重比较方法多,Fisher提出最小差异显著least significant difference,LSD
The null hypothesis in a one-way ANOVA is that the means of all the samples are
the same. So if a one-way ANOVA yields a significant result, we only know that
they are not the same.
However, often we are not just interested in the joint hypothesis if all samples are
the same, but we would also like to know for which pairs of samples the hypothesis
of equal values is rejected. In this case we conduct several tests at the same time,
one test for each pair of samples. (Typically, this is done with t-tests.)
These tests are sometimes referred to as post-hoc analysis. In the design and
analysis of experiments, a post hoc analysis (from Latin post hoc, “after this”)
consists of looking at the data—after the experiment has concluded—for patterns
that were not specified beforehand. Here this is the case, because the null hypothesis
of the ANOVA is that there is no difference between the groups.
This results, as a consequence, in a multiple testing problem: since we perform
multiple comparison tests, we should compensate for the risk of getting a significant
result, even if our null hypothesis is true. This can be done by correcting the p-values
to account for this. We have a number of options to do so:
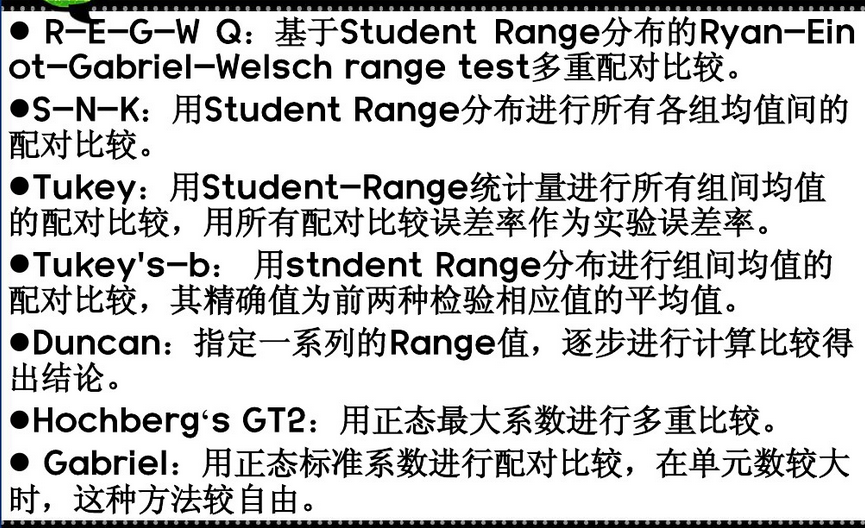
• TukeyHSD
• Bonferroni correction
• Holms correction
• : : : and others : : :
https://study.163.com/provider/400000000398149/index.htm?share=2&shareId=400000000398149( 欢迎关注博主主页,学习python视频资源,还有大量免费python经典文章)