python机器学习-乳腺癌细胞挖掘(博主亲自录制视频)

医药统计项目联系QQ:231469242
All rights reversed
commercial use not allowed
北京数据


重庆数据


美国Rockwell


澳大利亚悉尼


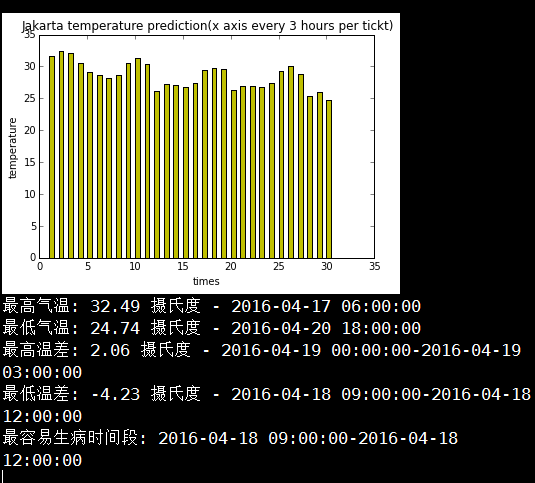
印尼雅加达

London 英国


# -*- coding: utf-8 -*-
# All rights reversed, commercial use not allowed
#! python3
# quickWeather.py - Prints the current weather for a location from the command line.
"""
k(开尔文)=273.15+T(摄氏度) json返回的是开尔文温度
Created on Sat Apr 16 10:24:28 2016

@author: daxiong
"""

import json, requests,sys,pylab,numpy

#城市名称
cityName="beijing"
#城市ID号
cityID="2038349"
#我的免费appID
appID="0383ae59663e14ab5a6855d5b6ad5d00"
#获取时间段数
cnt="30"
# Download the JSON data from OpenWeatherMap.org's API
url="http://api.openweathermap.org/data/2.5/forecast/city?id=%s&APPID=%s&cnt=%s"%(cityID,appID,cnt)
response = requests.get(url)
response.raise_for_status()

# Load JSON data into a Python variable.
weatherData = json.loads(response.text)


# Print weather descriptions.
#主要获取weatherData---weather---main和description信息
w = weatherData['list']
print('Current weather in %s:' % (cityName))

temperature_list=[]
cnt_list=[]
time_list=[]
for i in range(int(cnt)):
    time=w[i]['dt_txt']
    print(time)
    main=w[i]['weather'][0]['main']
    description=w[i]['weather'][0]['description']
    temp=w[i]['main']['temp']
    temp_Chinese=temp-273.15
    temp_Chinese_round=round(temp_Chinese,2)
    temperature_list.append(temp_Chinese_round)
    cnt_list.append(i+1)
    time_list.append(str(time))
    print(main, '-',description,'-',temp_Chinese_round,"摄氏度")
    print()


barwidth=0.5
pylab.bar(cnt_list,temperature_list,width=barwidth,color='y')
pylab.xlabel("times")
pylab.ylabel('temperature')
pylab.title("%s temperature prediction(x axis every 3 hours per tickt)"%cityName)
pylab.show()

#计算最高气温和最低气温
list_temperature_time=zip(temperature_list,time_list)
dict_temperature_time=dict(list_temperature_time)
max_temp=max(dict_temperature_time.keys())
min_temp=min(dict_temperature_time.keys())
print("最高气温:",max_temp,'摄氏度','-',dict_temperature_time[max_temp])
print("最低气温:",min_temp,'摄氏度','-',dict_temperature_time[min_temp])

#温差列表,用于统计哪天人最容易生病
temperature_difference_list=[]
for i in range(len(temperature_list)-1):
    temperature_difference=temperature_list[i+1]-temperature_list[i]
    temperature_difference_list.append(temperature_difference)

time_difference_list=[]
for i in range(len(time_list)-1):
    time_difference=time_list[i]+'-'+time_list[i+1]
    time_difference_list.append(time_difference)

list_temperature_time_difference=zip(temperature_difference_list,time_difference_list)
dict_temperature_time_difference=dict(list_temperature_time_difference)
max_temp_difference=max(dict_temperature_time_difference.keys())
min_temp_difference=min(dict_temperature_time_difference.keys())
print("最高温差:",round(max_temp_difference,2),'摄氏度','-',dict_temperature_time_difference[max_temp_difference])
print("最低温差:",round(min_temp_difference,2),'摄氏度','-',dict_temperature_time_difference[min_temp_difference])


#最容易生病时间段,取温差绝对值最大的key
if abs(max_temp_difference)>abs(min_temp_difference):
    ill_likely_day=dict_temperature_time_difference[max_temp_difference]
else:
    ill_likely_day=dict_temperature_time_difference[min_temp_difference]
print("最容易生病时间段:",ill_likely_day)

#统计温差又高到底排序的时间段
#温差绝对值列表
absolute_temperature_difference_list=[abs(i) for i in temperature_difference_list]
list_temperature_time_difference=zip(absolute_temperature_difference_list,time_difference_list)
dict_absolute_temperature_time_difference=dict(list_temperature_time_difference)
sorted_temperature_time_difference=sorted(dict_absolute_temperature_time_difference.items(),reverse=True)


'''
# Compute location from command line arguments.
if len(sys.argv) < 2:
    print('Usage: quickWeather.py location')
    sys.exit()
location = ' '.join(sys.argv[1:])


len(weatherData)
Out[21]: 5
for i in weatherData:
    print(i)
city  #城市信息
cod   #内部参数
cnt   #预测天数
list  #信息列表,主要获取weatherData---weather---main和description信息
message #内部参数

weatherData
Out[23]:
{'city': {'coord': {'lat': 30.25, 'lon': 107.75},
  'country': 'CN',
  'id': 1814905,
  'name': 'Chongqing Shi',
  'population': 0,
  'sys': {'population': 0}},
 'cnt': 1,
 'cod': '200',
 'list': [{'clouds': {'all': 44},
   'dt': 1460775600,
   'dt_txt': '2016-04-16 03:00:00',
   'main': {'grnd_level': 937.55,
    'humidity': 98,
    'pressure': 937.55,
    'sea_level': 1025.81,
    'temp': 288.16,
    'temp_kf': 0.4,
    'temp_max': 288.16,
    'temp_min': 287.759},
   'rain': {'3h': 0.01},
   'sys': {'pod': 'd'},
   'weather': [{'description': 'light rain',
     'icon': '10d',
     'id': 500,
     'main': 'Rain'}],
   'wind': {'deg': 267.501, 'speed': 1.63}}],
 'message': 0.0109}


#pylab.hist(temperature_list)
pylab.plot(cnt_list,temperature_list,'ro')
pylab.xlabel("times")
pylab.ylabel('temperature')
pylab.title("%s temperature prediction"%cityName)
pylab.show()
'''
https://study.163.com/provider/400000000398149/index.htm?share=2&shareId=400000000398149( 欢迎关注博主主页,学习python视频资源,还有大量免费python经典文章)
