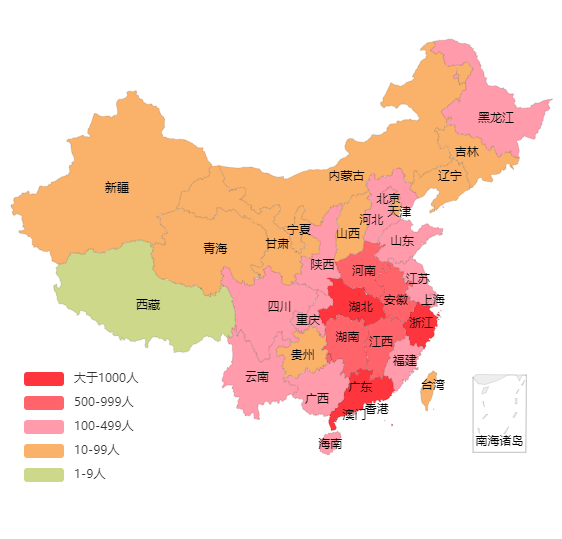
HTML:

<div id="china_map" style='100%x;height:600px;'></div>


以下是echarts地图相关代码
dataList () {
// 初始化echarts实例
this.chinachart = echarts.init(document.getElementById('china_map'))
// 进行相关配置
var chartOption = {
tooltip: { // 鼠标移到图里面的浮动提示框
// formatter详细配置: https://echarts.baidu.com/option.html#tooltip.formatter
formatter (params) {
// params.data 就是series配置项中的data数据遍历
let confirmedNum,
curesNum,
deathsNum
if (params.data) {
confirmedNum = params.data.confirmedNum
curesNum = params.data.curesNum
deathsNum = params.data.deathsNum
} else { // 为了防止没有定义数据的时候报错写的
confirmedNum = 0
curesNum = 0
deathsNum = 0
}
let htmlStr = `
<div style='font-size:18px;'> ${params.name}</div>
<p style='text-align:left;margin-top:10px;'>
确诊:${confirmedNum}<br/>
治愈:${curesNum}<br/>
死亡:${deathsNum}<br/>
</p>
`
return htmlStr
}
// backgroundColor:"#ff7f50",//提示标签背景颜色
// textStyle:{color:"#fff"} //提示标签字体颜色
},
// visualMap的详细配置解析:https://echarts.baidu.com/option.html#visualMap
visualMap: { // 左下角的颜色区域
type: 'piecewise', // 定义为分段型 visualMap
min: 0,
max: 1000,
itemWidth: 40,
bottom: 60,
left: 20,
pieces: [ // 自定义『分段式视觉映射组件(visualMapPiecewise)』的每一段的范围,以及每一段的文字,以及每一段的特别的样式
{gte: 0, lte: 9, label: '1-9人', color: '#ced88b'}, // (900, 1000]
{gte: 10, lte: 99, label: '10-99人', color: '#fab26b'}, // (500, 900]
{gte: 100, lte: 499, label: '100-499人', color: '#ff9baa'}, // (310, 500]
{gte: 500, lte: 999, label: '500-999人', color: '#ff646b'}, // (200, 300]
{gte: 1000, label: '大于1000人', color: '#ff353d'} // (10, 200]
]
},
geo: { // 地理坐标系组件用于地图的绘制
map: 'china', // 表示中国地图
// roam: true, // 是否开启鼠标缩放和平移漫游
zoom: 1.2, // 当前视角的缩放比例(地图的放大比例)
label: {
show: true
},
itemStyle: { // 地图区域的多边形 图形样式。
borderColor: 'rgba(0, 0, 0, 0.2)',
emphasis: { // 高亮状态下的多边形和标签样式
shadowBlur: 20,
areaColor: '#ffffff',
shadowColor: 'rgba(0, 0, 0, 0.5)'
}
}
},
series: [
{
name: '', // 浮动框的标题(上面的formatter自定义了提示框数据,所以这里可不写)
type: 'map',
geoIndex: 0,
label: {
show: true
},
// 这是需要配置地图上的某个地区的数据,根据后台的返回的数据进行拼接(下面是我定义的假数据)
data:[{confirmedNum: 22112,//数据我只写了一组,其余的可以自己写
curesNum: 831,
deathsNum: 618,
name: "湖北",
value: 22112
}]
}]
}
]
}
// 使用刚指定的配置项和数据显示地图数据
this.chinachart.setOption(chartOption)
// 对window窗口变化加监听事件
window.addEventListener('resize', () => {
this.chinachart.resize()
})
}
