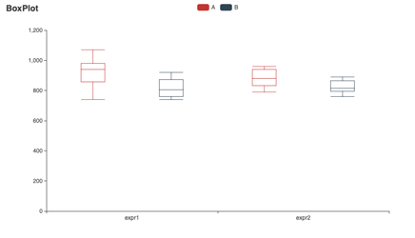
from pyecharts import options as opts
from pyecharts.charts import Boxplot

v1 = [
    [850, 740, 900, 1070, 930, 850, 950, 980, 980, 880, 1000, 980],
    [960, 940, 960, 940, 880, 800, 850, 880, 900, 840, 830, 790],
]
v2 = [
    [890, 810, 810, 820, 800, 770, 760, 740, 750, 760, 910, 920],
    [890, 840, 780, 810, 760, 810, 790, 810, 820, 850, 870, 870],
]
c = Boxplot()
c.add_xaxis(["expr1", "expr2"])
c.add_yaxis("A", c.prepare_data(v1))
c.add_yaxis("B", c.prepare_data(v2))
c.set_global_opts(title_opts=opts.TitleOpts(title="BoxPlot"))
c.render("/Users/war/Downloads/实验2.1.html")
from pyecharts import options as opts
from pyecharts.charts import Bar
from pyecharts.faker import Faker


x = Faker.dogs + Faker.animal
xlen = len(x)
y = []
for idx, item in enumerate(x):
    if idx <= xlen / 2:
        y.append(
            opts.BarItem(
                name=item,
                value=(idx + 1) * 10,
                itemstyle_opts=opts.ItemStyleOpts(color="#749f83"),
            )
        )
    else:
        y.append(
            opts.BarItem(
                name=item,
                value=(xlen + 1 - idx) * 10,
                itemstyle_opts=opts.ItemStyleOpts(color="#d48265"),
            )
        )

c = (
    Bar()
    .add_xaxis(x)
    .add_yaxis("series0", y, category_gap=0, color=Faker.rand_color())
    .set_global_opts(title_opts=opts.TitleOpts(title="Bar-直方图(颜色区分)"))
    .render("/Users/war/Downloads/实验2.2.html")
)