import pyecharts.options as opts
from pyecharts.charts import Bar3D
Hair = ["Black","Brown","Red","Blond","Total"]
Eye = ["Brown","Blue","Hazel","Green","Total"]

data = [
    [0, 0, 68],
    [0, 1, 119],
    [0, 2, 26],
    [0, 3, 7],
    [0, 4, 220],
    [1, 0, 20],
    [1, 1, 84],
    [1, 2, 17],
    [1, 3, 94],
    [1, 4, 215],
    [2, 0, 15],
    [2, 1, 54],
    [2, 2, 14],
    [2, 3, 10],
    [2, 4, 93],
    [3, 0, 5],
    [3, 1, 29],
    [3, 2, 14],
    [3, 3, 16],
    [3, 4, 64],
    [4, 0, 108],
    [4, 1, 286],
    [4, 2, 71],
    [4, 3, 127],
    [4, 4, 592],
]
data = [[d[1], d[0], d[2]] for d in data]


(
    Bar3D(init_opts=opts.InitOpts(width="1600px", height="800px"))
    .add(
        series_name="",
        data=data,
        xaxis3d_opts=opts.Axis3DOpts(type_="category", data=Hair),
        yaxis3d_opts=opts.Axis3DOpts(type_="category", data=Eye),
        zaxis3d_opts=opts.Axis3DOpts(type_="value"),
    )
    .set_global_opts(
        visualmap_opts=opts.VisualMapOpts(
            max_=500,
            range_color=[
                "#4575b4",
                "#74add1",
                "#abd9e9",
                "#e0f3f8",
                "#ffffbf",
                "#fee090",
                "#fdae61",
                "#f46d43",
                "#d73027",
                "#a50026",
            ],
        )
    )
    .render("bar3d_punch_card.html")
)

import random
from pyecharts import options as opts
from pyecharts.charts import HeatMap
from pyecharts.faker import Faker

Hair = ["Black","Brown","Red","Blond","Total"]
Eye = ["Brown","Blue","Hazel","Green","Total"]

data = [
    [0, 0, 68],
    [0, 1, 119],
    [0, 2, 26],
    [0, 3, 7],
    [0, 4, 220],
    [1, 0, 20],
    [1, 1, 84],
    [1, 2, 17],
    [1, 3, 94],
    [1, 4, 215],
    [2, 0, 15],
    [2, 1, 54],
    [2, 2, 14],
    [2, 3, 10],
    [2, 4, 93],
    [3, 0, 5],
    [3, 1, 29],
    [3, 2, 14],
    [3, 3, 16],
    [3, 4, 64],
    [4, 0, 108],
    [4, 1, 286],
    [4, 2, 71],
    [4, 3, 127],
    [4, 4, 592],
]
data = [[d[1], d[0], d[2]] for d in data]
c = (
    HeatMap()
    .add_xaxis(Hair)
    .add_yaxis(
        "series0",
        Eye,
        data,
        label_opts=opts.LabelOpts(is_show=True, position="inside"),
    )
    .set_global_opts(
        title_opts=opts.TitleOpts(title="HeatMap-Label 显示"),
        visualmap_opts=opts.VisualMapOpts(),
    )
    .render("/Users/war/Downloads/heatmap_with_label_show.html")
)

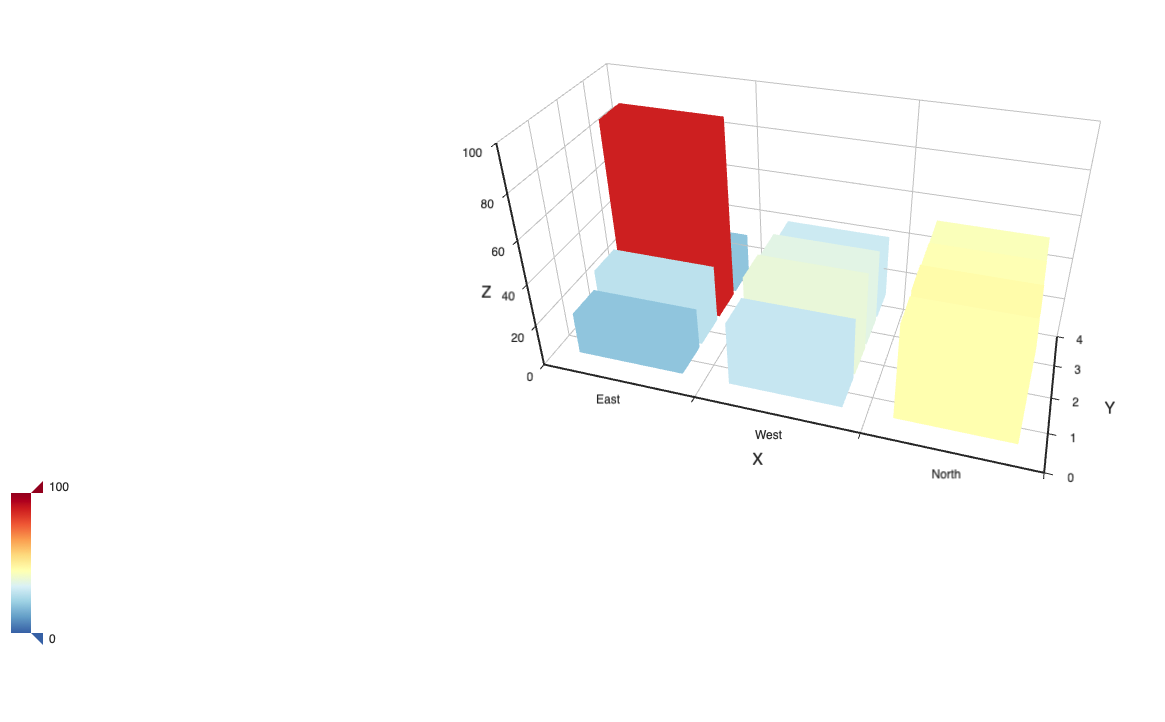
import pyecharts.options as opts
from pyecharts.charts import Bar3D
Dir = ["East","West","North"]

data = [
    [0, 1, 20],
    [0, 2, 28],
    [0, 3, 88],
    [0, 4, 20],
    [1, 1, 30],
    [1, 2, 38],
    [1, 3, 36],
    [1, 4, 31],
    [2, 1, 45],
    [2, 2, 46],
    [2, 3, 44],
    [2, 4, 43],
]
data = [[d[0], d[1], d[2]] for d in data]


(
    Bar3D(init_opts=opts.InitOpts(width="1600px", height="800px"))
    .add(
        series_name="",
        data=data,
        xaxis3d_opts=opts.Axis3DOpts(type_="category", data=Dir),
        yaxis3d_opts=opts.Axis3DOpts(type_="value"),
        zaxis3d_opts=opts.Axis3DOpts(type_="value"),
    )
    .set_global_opts(
        visualmap_opts=opts.VisualMapOpts(
            max_=100,
            range_color=[
                "#4575b4",
                "#74add1",
                "#abd9e9",
                "#e0f3f8",
                "#ffffbf",
                "#fee090",
                "#fdae61",
                "#f46d43",
                "#d73027",
                "#a50026",
            ],
        )
    )
    .render("/Users/war/Downloads/实验1.2.1.html")
)
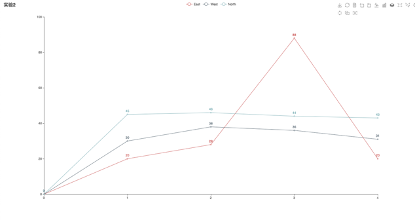
import pyecharts.options as opts
from pyecharts.charts import Line

Quarter = [0,1,2,3,4]
East = [0,20,28,88,20]
West = [0,30,38,36,31]
North = [0,45,46,44,43]

(
    Line(init_opts=opts.InitOpts(width="1600px", height="800px"))
    .add_xaxis(xaxis_data=Quarter)
    .add_yaxis(
        series_name="East",
        y_axis=East,
    )
    .add_yaxis(
        series_name="West",
        y_axis=West,
    )
    .add_yaxis(
        series_name="North",
        y_axis=North,
    )
    .set_global_opts(
        title_opts=opts.TitleOpts(title="实验2"),
        tooltip_opts=opts.TooltipOpts(trigger="axis"),
        toolbox_opts=opts.ToolboxOpts(is_show=True),
        xaxis_opts=opts.AxisOpts(type_="category", boundary_gap=False),
    )
    .render("/Users/war/Downloads/实验1.2.2.html")
)