官网地址:https://gallery.pyecharts.org/#/Bar/stack_bar_percent
bar=Bar(init_opts = opts.InitOpts(height='350px'))

for label in pm_a["分段"].unique():
    p = pm_a[pm_a["分段"]==label]
    bar.add_xaxis(list(p["City1"]))
    bar.add_yaxis(label,list((p["比率"]*100).round(2)),stack="stack1")

bar.set_series_opts(label_opts=opts.LabelOpts(is_show=False))
bar.set_global_opts(
                    title_opts=opts.TitleOpts(title="各地市分布图",pos_left="center"),
                   legend_opts=opts.LegendOpts(pos_top="8%"),
                   yaxis_opts=opts.AxisOpts(axislabel_opts=opts.LabelOpts(formatter="{value} %"),max_=100),
                    tooltip_opts=opts.TooltipOpts(formatter="{a}:{c} %")
                    )
bar.render_notebook()
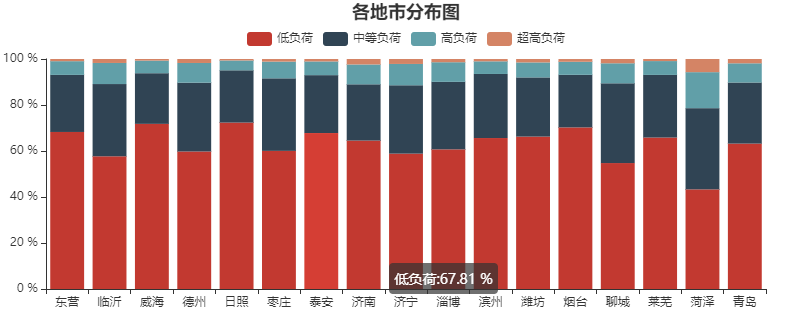
说明:
1.for label in pm_a["分段"].unique():
针对各地市的四种负荷情况,label的值:低负荷、中等负荷、高负荷、超高负荷。
2. bar.add_xaxis(list(p["City1"]))
x轴方向针对地市。
3.bar.add_yaxis(label,list((p["比率"]*100).round(2)),stack="stack1")
各种负荷中每个地市的比率,stack
4.
tooltip_opts=opts.TooltipOpts(formatter="{a}:{c} %")
# 标签内容格式器,支持字符串模板和回调函数两种形式,字符串模板与回调函数返回的字符串均支持用
换行。
# 字符串模板 模板变量有:
# {a}:系列名。
# {b}:数据名。
# {c}:数据值。
# {@xxx}:数据中名为 'xxx' 的维度的值,如 {@product} 表示名为 'product'` 的维度的值。
# {@[n]}:数据中维度 n 的值,如{@[3]}` 表示维度 3 的值,从 0 开始计数。
# 示例:formatter: '{b}: {@score}'