【计算机视觉领域】常用的 feature 提取方法,feature 提取工具包
利用 VL 工具包进行各种特征的提取:
VL 工具包官网地址:http://www.vlfeat.org/index.html
%% Extract Every kind of Features
% the VL_tool box for feature extraction.
clc;
run('/home/wangxiao/Documents/MATLAB/vlfeat-0.9.20-bin/vlfeat-0.9.20/toolbox/vl_setup.m')
imagePath = '/home/wangxiao/Documents/Sun-80-dataset/Sun_80_dataset/train_image_sun_256_256/' ;
Labeled_data = importdata('/home/wangxiao/Documents/Sun-80-dataset/Sun_80_dataset/SUN100_Label_train_0.5_.txt');
Unlabel_data = importdata('/home/wangxiao/Documents/Sun-80-dataset/Sun_80_dataset/SUN100_Unlabel_train_0.5_.txt');
for i = 1:size(Labeled_data.data, 1)
imageName = Labeled_data.textdata{i, 1};
% image = imread([imagePath, imageName]);
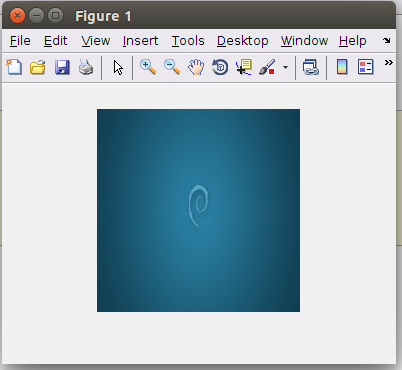
image = imread('/home/wangxiao/Pictures/wallhaven-382471.png');
image = imresize(image, [224, 224]);
% change the image into single precision.
figure; imshow(image);
imgs = im2single(rgb2gray(image)) ;
%%%%%%%%%%%%%%%%%%%%%%%%%%%%%%%%%%%%%%%%%%%%%
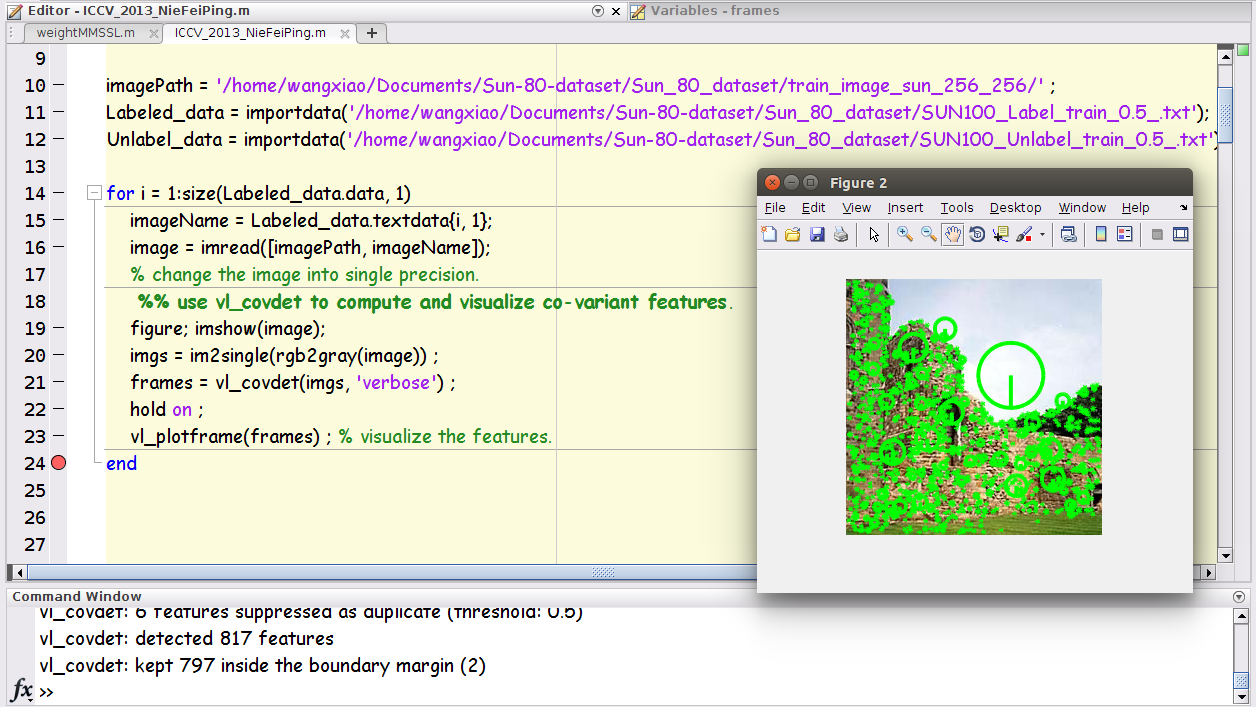
%% use vl_covdet to compute and visualize co-variant features.
%%%%%%%%%%%%%%%%%%%%%%%%%%%%%%%%%%%%%%%%%%%%%
frames = vl_covdet(imgs, 'verbose') ;
hold on ;
vl_plotframe(frames) ; % visualize the features.
%%%%%%%%%%%%%%%%%%%%%%%%%%%%%%%%%%%%%%%%%%%%%
%% use vl_hog to extract the hog feature.
%%%%%%%%%%%%%%%%%%%%%%%%%%%%%%%%%%%%%%%%%%%%%
cellSize = 8 ;
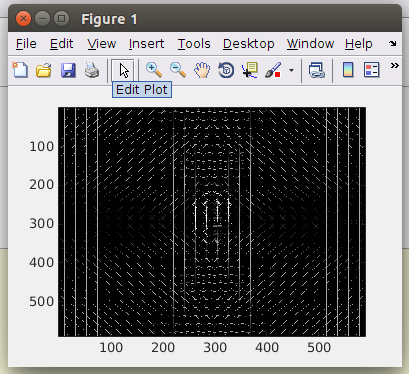
hog = vl_hog(imgs, cellSize, 'verbose') ;
imhog = vl_hog('render', hog, 'verbose') ;
clf ; imagesc(imhog) ; colormap gray ;
%%%%%%%%%%%%%%%%%%%%%%%%%%%%%%%%%%%%%%%%%%%%%
%% use vl_sift to extract the sift feature.
%%%%%%%%%%%%%%%%%%%%%%%%%%%%%%%%%%%%%%%%%%%%%
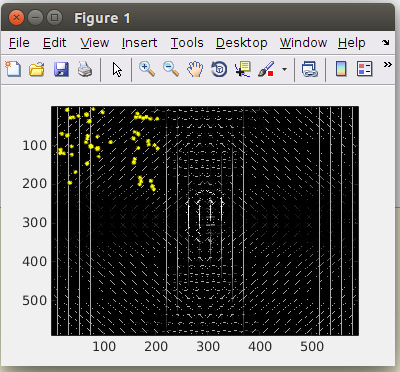
[f,d] = vl_sift(imgs) ;
perm = randperm(size(f,2)) ;
sel = perm(1:50) ;
h1 = vl_plotframe(f(:,sel)) ;
h2 = vl_plotframe(f(:,sel)) ;
set(h1,'color','k','linewidth',3) ;
set(h2,'color','y','linewidth',2) ;
%%%%%%%%%%%%%%%%%%%%%%%%%%%%%%%%%%%%%%%%%%%%%
%% use vl_mser to extact the mser feature.
%%%%%%%%%%%%%%%%%%%%%%%%%%%%%%%%%%%%%%%%%%%%%
I = uint8(rgb2gray(image)) ;
[r,f] = vl_mser(I,'MinDiversity',0.7,...
'MaxVariation',0.2,...
'Delta',10) ;
f = vl_ertr(f) ;
vl_plotframe(f) ;
M = zeros(size(I)) ;
for x=r'
s = vl_erfill(I,x) ;
M(s) = M(s) + 1;
end
figure(2) ;
clf ; imagesc(I) ; hold on ; axis equal off; colormap gray ;
[c,h]=contour(M,(0:max(M(:)))+.5) ;
set(h,'color','y','linewidth',3) ;
%%%%%%%%%%%%%%%%%%%%%%%%%%%%%%%%%%%%%%%%%%%%%
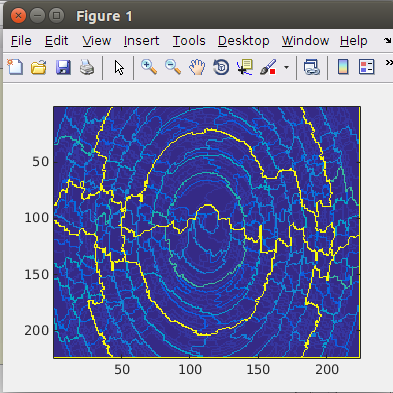
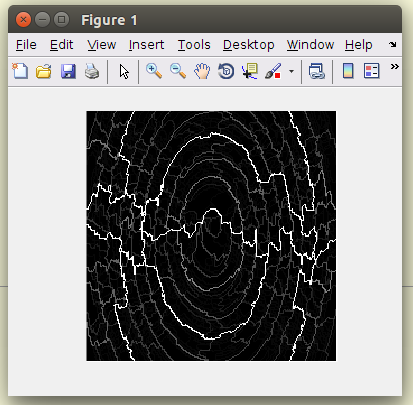
%% use vl_quickseg to execute Quick shift.
%%%%%%%%%%%%%%%%%%%%%%%%%%%%%%%%%%%%%%%%%%%%%
I = uint8(rgb2gray(image));
ratio = 0.5;
kernelsize = 2;
maxdist = 50;
ndists = 10;
Iseg = vl_quickseg(I, ratio, kernelsize, maxdist);
Iedge = vl_quickvis(I, ratio, kernelsize, maxdist, ndists) ;
imagesc(Iedge);
axis equal off tight;
colormap gray;
end