The procedure falls into two parts: first we start an application as usual and then connect to it with the debugger.
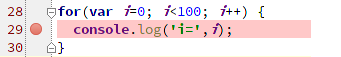
- Set the breakpoints in the Node.js code, where necessary. At least one breakpoint is necessary otherwise the program will be just executed. If you want the debugging tool to stop at the first line of your code, set a breakpoint at the first line.
- Create a Node.js run configuration with the following option in the Node parameters text box: --debug-brk==<port for connect to debugger remotely>
Note
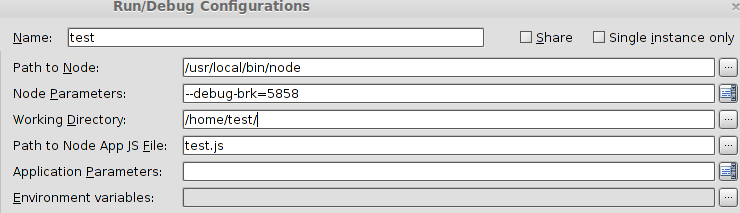
- The --debug-brk option allows you to debug the code executed on start.
- The --debug option is useful when you are not going to debug Node.js right now, but you want to debug it later.
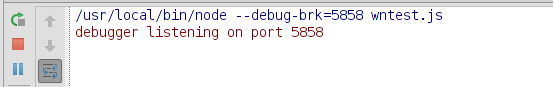
- Run the application with the created configuration.
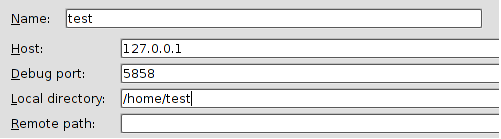
- Create a Node.js Remote Debug configuration: in the Debug port text box, type the port number specified in the currently running Node.js configuration.
- With the application still running, launch the Node.js Remote Debug configuration (select the configuration in the list and click the Debug toolbar button
 ).
).
- In the Run tool window, copy the URL address of the server and open the corresponding page in the browser. Control over the debugging session returns to WebStorm.
- Switch to WebStorm. In the Debug tool window, step through the breakpoints, switch between frames, change values on-the-fly, examine a suspended program, evaluate expressions, and set watches.