Filebeat 5.x版本
风来了.fox
1.下载和安装
https://www.elastic.co/downloads/beats/filebeat这里选择 LINUX 64-BIT 即方式一
https://artifacts.elastic.co/downloads/beats/filebeat/filebeat-5.6.3-linux-x86_64.tar.gz
tar -zxvf filebeat-5.6.3-linux-x86_64.tar.gz
2.配置Filebeat
环境说明:
1)elasticsearch和logstash 在不同/相同的服务器上,只发送数据给logstash/elasticsearch
2)监控nginx日志
3)监控站点日志
2.1配置
编辑filebeat.yml
vim filebeat.yml修改为
filebeat.prospectors:
    - input_type: log
      paths:
        - /www/wwwLog/www.foxwho.com/*.log
      input_type: log
      document_type: nginx-www.foxwho.com
      multiline.pattern: '^['
      multiline.negate: true
      multiline.match: after

    - input_type: log
      paths:
        - /www/wwwroot/www.foxwho.com/runtime/log/*/[0-9]*[_w]?*.log
      input_type: log
      document_type: web-www.foxwho.com
      multiline.pattern: '^['
      multiline.negate: true
      multiline.match: after

#output.elasticsearch:
  #   hosts: ["localhost:9200"]
  #   index: "filebeat-www.babymarkt.cn"
  #   template.name: "filebeat"
  #   template.path: "filebeat.template.json"
  #   template.overwrite: false
output.logstash:
    hosts: ["10.1.5.65:5044"]

...其他部分没有改动,不需要修改
2.2 说明
- paths:指定要监控的日志,目前按照Go语言的glob函数处理。没有对配置目录做递归处理,比如配置的如果是:
/var/log/* /*.log则只会去/var/log目录的所有子目录中寻找以”.log”结尾的文件,而不会寻找/var/log目录下以”.log”结尾的文件。
2. input_type:指定文件的输入类型log(默认)或者stdin。
3. document_type:设定Elasticsearch输出时的document的type字段,也可以用来给日志进行分类。
把 elasticsearch和其下的所有都注释掉(这里Filebeat是新安装的,只注释这2处即可)
#output.elasticsearch:
  #   hosts: ["localhost:9200"]
开启 logstash(删除这两行前的#号),并把localhost改为logstash服务器地址
output.logstash:
    hosts: ["10.1.5.65:5044"]
如果开启logstash了,那么Logstash配置中要设置监听端口 5044:
这个是默认文件位置,如果不存在请自行查找
建立beats-input.conf配置文件
vim /etc/logstash/etc/beats-input.conf增加端口
input {
  beats {
    port => 5044
  }
}
3.启动
3.1 测试
./filebeat -e -c filebeat.yml -d "Publish"如果能看到一堆东西输出,表示正在向elasticsearch或logstash发送日志。
如果是elasticsearch可以浏览:http://localhost:9200/_search?pretty 如果有新内容返回,表示ok
测试正常后,Ctrl+C结束
3.2启动
nohup ./filebeat -e -c filebeat.yml &上面会转入后台运行
3.3停止
查找进程 ID
ps -ef |grep filebeatKILL他
kill -9 id3.X kibana设置
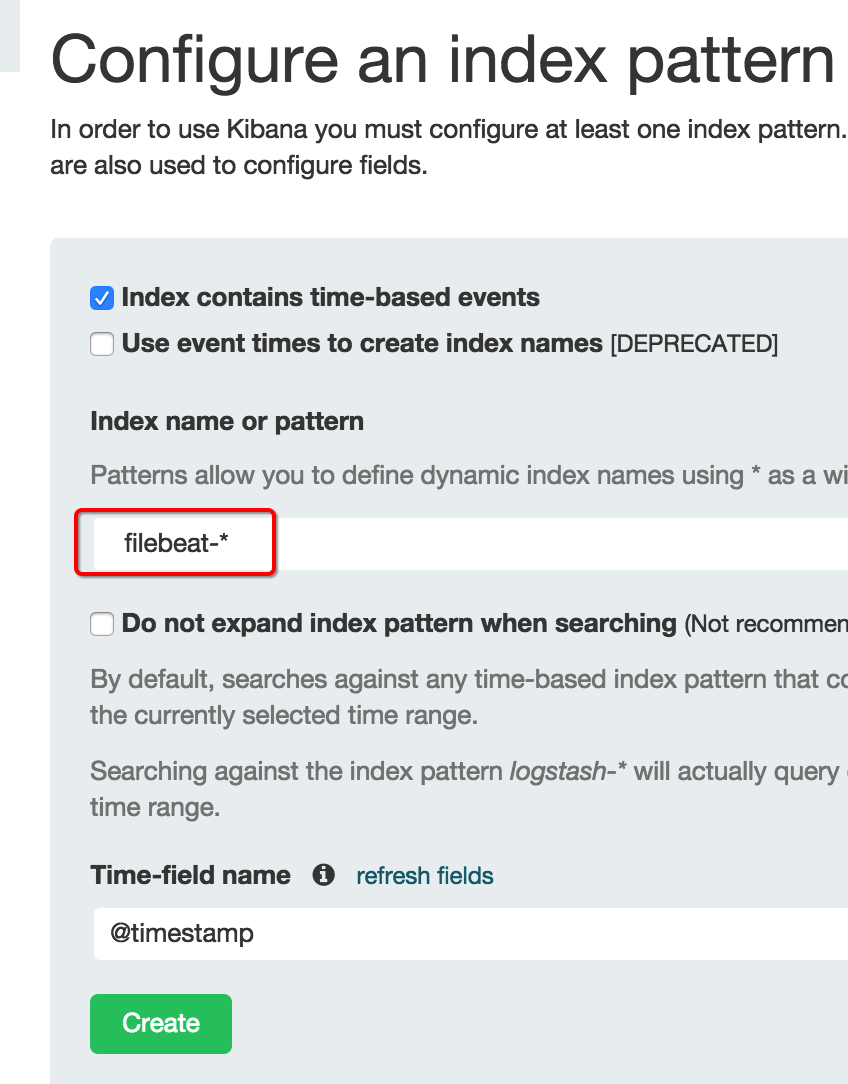
如果使用 kibana 做日志分析,
在kibana里,创建一个索引,注意pattern为:filebeat-*
4.高级配置说明
http://kibana.logstash.es/content/beats/file.html
http://blog.csdn.net/a464057216/article/details/51233375
5.其他说明
5.1Elasticsearch知道如何处理每个日志事件
默认的Elasticsearch需要的index template在安装Filebeat的时候已经提供,路径为/etc/filebeat/filebeat.template.json,可以使用如下命令装载该模板:
在 filebeat 安装目录中运行
curl -XPUT 'http://localhost:9200/_template/filebeat?pretty' -d@filebeat.template.json如果运行成功则返回如下,表示模板已被接收
{
  "acknowledged" : true
}
每次修改Filebeat配置,重启Filebeat才能生效
部分来源:
http://blog.csdn.net/a464057216/article/details/50987695
http://www.cnblogs.com/yjmyzz/p/filebeat-turorial-and-kibana-login-setting-with-nginx.html