一、 动态折线图
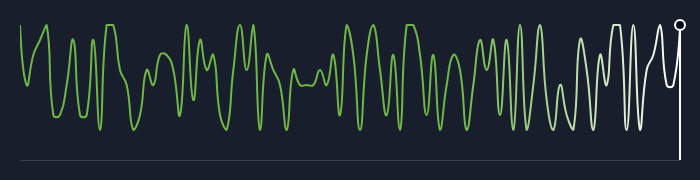


该部分是基于echarts开发的,主要有两部分组成,折线图和柱状图,其中末端的垂直细线和小圆球为柱状图部分,小球是柱状图的markPoint设置的,柱状图的data数据是与折线图data数据数组长度相同的数组,数组最后一项与折线图数组的最后一项等值,其余项均为0,具体配置如下:

动态设置的实现:在数组末端插入数据,同时去除数组的第一项,echarts更新,从而实现动态效果
二、 echarts关系图
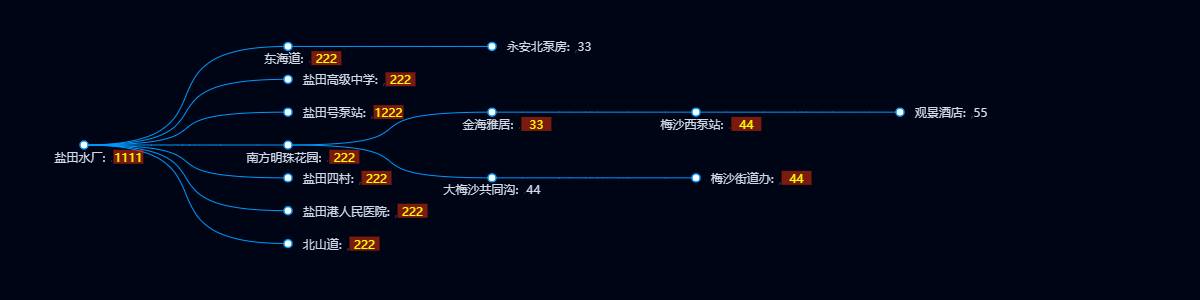
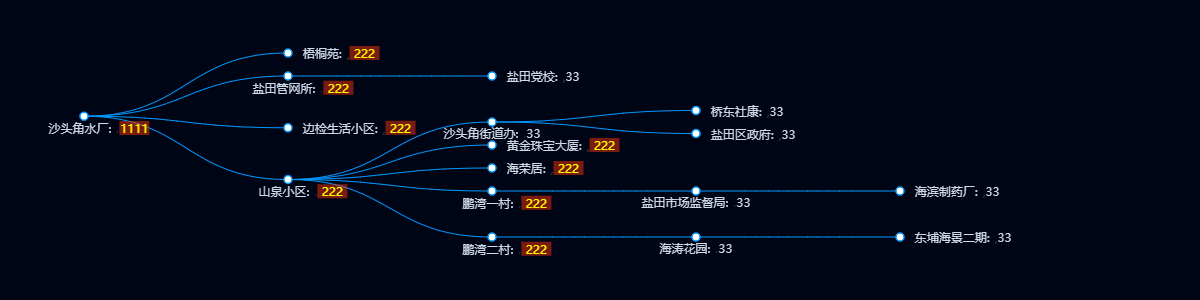
该部分是基于echarts(tree型图)开发的,其data数据格式有限制(详情见文件:关系图数据格式.text),数据中的name字段包含label标签的所有数据信息,报警及非报警状态时label中字体及背景颜色,是echarts中的富文本结合正则实现的,具体配置如下:

动态echarts源码


  1   1 <template>
  2   2  <div>
  3   3  <div id="echart1" ref="echart1"></div>
  4   4  <div>{{show}}</div>
  5   5  </div>
  6   6 </template>
  7   7 <script>
  8   8 export default {
  9   9  name: "echart1",
 10  10  data() {
 11  11  return {
 12  12  aadata: [],
 13  13  bbdata: [],
 14  14  ccdata: [],
 15  15  zydata: [],
 16  16  show: []
 17  17  };
 18  18  },
 19  19  mounted() {
 20  20  var that = this;
 21  21  var aa = Math.random();
 22  22  var cc = [];
 23  23  for (var i = 0; i < 100; i++) {
 24  24  that.aadata.push(aa);
 25  25  that.bbdata.push(i);
 26  26  cc.push(0);
 27  27  }
 28  28  cc.splice(cc.length - 1, 1, that.aadata[that.aadata.length - 1]);
 29  29  that.ccdata = cc;
 30  30  that.api();
 31  31  setInterval(function() {
 32  32  that.api();
 33  33  }, 100);
 34  34  },
 35  35  /* watch: {
 36  36  aadata() {
 37  37  this.drawLine();
 38  38  }
 39  39  }, */
 40  40  methods: {
 41  41  api() {
 42  42  var that = this;
 43  43  var obj = { CodeID: ["1"] };
 44  44  that.$axios
 45  45  .post(
 46  46  url,
 47  47  JSON.stringify(obj),
 48  48  { headers: { "Content-Type": "application/json;" } }
 49  49  )
 50  50  .then(res => {
 51  51  var that = this;
 52  52  that.show = res.data.Item;
 53  53  var b = res.data.Item[0];
 54  54  that.aadata.shift();
 55  55  that.bbdata.shift();
 56  56  that.aadata.push(b);
 57  57  that.bbdata.push(b);
 58  58  that.ccdata.splice(that.zydata.length - 1, 1, b);
 59  59  that.drawLine();
 60  60  })
 61  61  .catch(error => {
 62  62  console.log(error);
 63  63  });
 64  64  },
 65  65  drawLine() {
 66  66  var that = this;
 67  67  var myChart = this.$echarts.init(this.$refs.echart1);
 68  68  myChart.setOption({
 69  69  backgroundColor:"rgba(0,5,21,0.9)",
 70  70  grid:{
 71  71  height:"150",
 72  72  top:"10",
 73  73  bottom:"10",
 74  74  right:"20",
 75  75  left:"20"
 76  76  },
 77  77  xAxis: {
 78  78  type: "category",
 79  79  boundaryGap: false,
 80  80  data: that.bbdata,
 81  81  axisTick:{
 82  82  show:false
 83  83  },
 84  84  axisLabel:{
 85  85  show:false
 86  86  },
 87  87  axisLine: {
 88  88  lineStyle: {
 89  89  color: '#3a3e4d',
 90  90   1
 91  91  }
 92  92  }
 93  93  },
 94  94  yAxis: {
 95  95  type: "value",
 96  96  show:false
 97  97  },
 98  98  series: [
 99  99  {
100 100  data: that.aadata,
101 101  type: "line",
102 102  animation: false,
103 103  smooth: true,
104 104  symbol: "none",
105 105  lineStyle: {
106 106  color: {
107 107  type: "linear",
108 108  colorStops: [
109 109  {
110 110  offset: 0,
111 111  color: "#00e4fc" // 0% 处的颜色
112 112  },
113 113  {
114 114  offset: 0.66,
115 115  color: "#00e4fc" // 66% 处的颜色
116 116  },
117 117  {
118 118  offset: 1,
119 119  color: "#fff" // 100% 处的颜色
120 120  }
121 121  ],
122 122  opacity: 0.4,
123 123  globalCoord: false // 缺省为 false
124 124  }
125 125  }
126 126  },
127 127  {
128 128  name: "最高气温",
129 129  barWidth: 2,
130 130  type: "bar",
131 131  data: that.ccdata,
132 132  animation: false,
133 133  itemStyle:{
134 134  normal:{
135 135  color:'#fff'
136 136  }
137 137  },
138 138  markPoint: {
139 139  animation: false,
140 140  symbol: 'circle',
141 141  data: [{ type: "max" }],
142 142  symbolSize:10,
143 143  itemStyle: {
144 144  normal: {
145 145  color:"#020b1c",
146 146  borderColor:"#fff",
147 147  borderWidth:"2",
148 148  label: {
149 149  show: false,
150 150  }
151 151  }
152 152  }
153 153  }
154 154  }
155 155  ]
156 156  });
157 157  }
158 158  }
159 159 };
160 160 </script>
161 161 <style scoped>
162 162 #echart1 {
163 163   700px;
164 164  height: 180px;
165 165 }
166 166 </style>
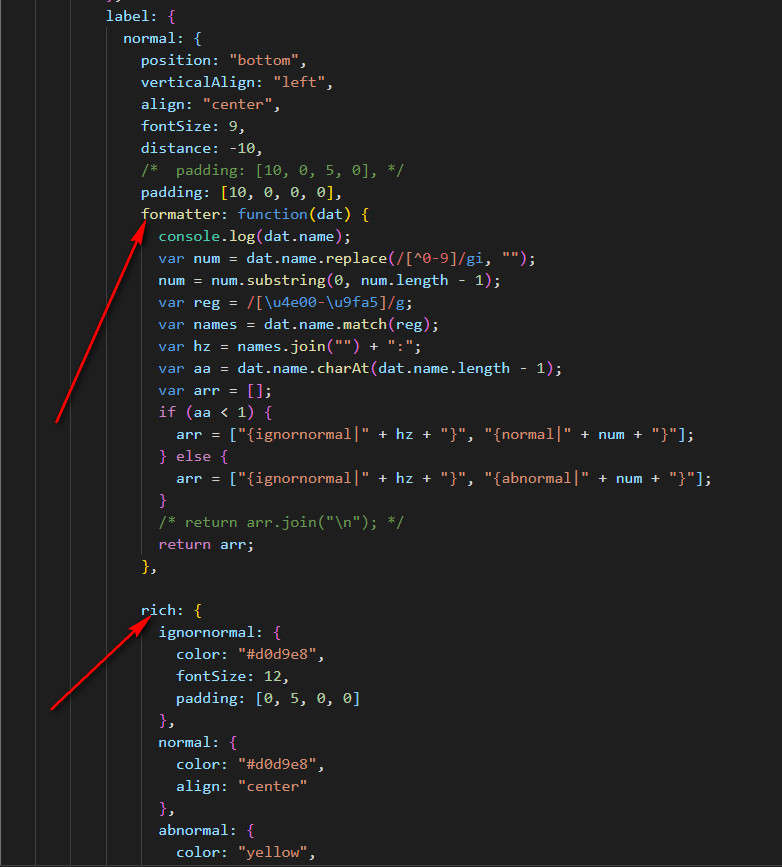
关系图源码如下:
  1 <template>
  2  <div>
  3  <div id="echart4" ref="echart4" style=" 1200px;height:300px;"></div>
  4  </div>
  5 </template>
  6 <script>
  7 export default {
  8  name: "echart4",
  9  data() {
 10  return {
 11  chartData: [
 12  {
 13  name: "盐田水厂11111",
 14  children: [
 15  {
 16  name: "东海道2221",
 17  children: [
 18  {
 19  name: "永安北泵房330"
 20  }
 21  ]
 22  },
 23  {
 24  name: "盐田高级中学2221"
 25  },
 26  {
 27  name: "盐田1号泵站2221"
 28  },
 29  {
 30  name: "南方明珠花园2221",
 31  children: [
 32  {
 33  name: "金海雅居331",
 34  children: [
 35  {
 36  name: "梅沙西泵站441",
 37  children: [
 38  {
 39  name: "观景酒店550"
 40  }
 41  ]
 42  }
 43  /* {
 44  name: "第三级441"
 45  } */
 46  ]
 47  },
 48  {
 49  name: "大梅沙共同沟440",
 50  children: [
 51  {
 52  name: "梅沙街道办441"
 53  }
 54  ]
 55  }
 56  ]
 57  },
 58  {
 59  name: "盐田四村2221"
 60  },
 61  {
 62  name: "盐田港人民医院2221"
 63  },
 64  {
 65  name: "北山道2221"
 66  /* children: [
 67  {
 68  name: "第三级331"
 69  },
 70  {
 71  name: "第三级331"
 72  }
 73  ] */
 74  }
 75  ]
 76  }
 77  ]
 78  };
 79  },
 80  mounted() {
 81  this.initChart();
 82  },
 83
 84   methods: {
 85     initChart() {
 86       this.chart = this.$echarts.init(this.$refs.echart4);
 87       this.chart.setOption({
 88           backgroundColor:"#000515",
 89         series: [
 90           {
 91             type: "tree",
 92             name: "tree2",
 93             data: this.chartData,
 94             top: "10%",
 95             bottom: "10%",
 96             right: "25%",
 97             height: "230",
 98             left: "7%",
 99             symbolSize: 8,
100             /*  symbol: "circle", */
101             // 展开发的层级数
102             initialTreeDepth: 10,
103             itemStyle: {
104               color: "#515b67",
105               borderColor: "#0098ff"
106             },
107             label: {
108               normal: {
109                 position: "bottom",
110                 verticalAlign: "left",
111                 align: "center",
112                 fontSize: 9,
113                 distance: -10,
114                 /*  padding: [10, 0, 5, 0], */
115                 padding: [10, 0, 0, 0],
116                 formatter: function(dat) {
117                   console.log(dat.name);
118                   var num = dat.name.replace(/[^0-9]/gi, "");
119                   num = num.substring(0, num.length - 1);
120                   var reg = /[u4e00-u9fa5]/g;
121                   var names = dat.name.match(reg);
122                   var hz = names.join("") + ":";
123                   var aa = dat.name.charAt(dat.name.length - 1);
124                   var arr = [];
125                   if (aa < 1) {
126                     arr = ["{ignornormal|" + hz + "}", "{normal|" + num + "}"];
127                   } else {
128                     arr = ["{ignornormal|" + hz + "}", "{abnormal|" + num + "}"];
129                   }
130                   /* return arr.join("
"); */
131                   return arr;
132                 },
133
134
135
136
137                 rich: {
138                   ignornormal: {
139                     color: "#d0d9e8",
140                     fontSize: 12,
141                     padding: [0, 5, 0, 0]
142                   },
143                   normal: {
144                     color: "#d0d9e8",
145                     align: "center"
146                   },
147                   abnormal: {
148                     color: "yellow",
149                     backgroundColor: "rgba(245,48,8,0.5)",
150                        "3",
151                     height: "14",
152                      align: "center"
153                   }
154                 }
155               }
156             },
157             // 线的样式
158             lineStyle: {
159               color: "#0098ff",
160               curveness: "0.8",
161             "1"
162             },
163             leaves: {
164               label: {
165                 normal: {
166                   // 叶子节点字的样式
167                   /*  position: 'left',
168                           verticalAlign: 'top',
169                           align: 'left', */
170                   position: "right",
171                   verticalAlign: "middle",
172                   align: "left",
173                   fontSize: 12,
174                   distance: 10,
175                   padding: [0, 5, 0, 0]
176                 }
177               }
178             },
179             expandAndCollapse: true,
180             animationDuration: 550,
181             animationDurationUpdate: 750
182           }
183         ]
184       });
185     },
186     hidePopoverPanel() {
187       this.popoverPanelShow = false;
188     }
189   }
190 };
191 </script>
192 <style scoped>
193 /* #echart4 {
194    700px;
195   height: 300px;
196 } */
197 </style>