由于先前在一些论坛中谈论到这个插件的运用,留了一些QQ联系方式,最近老是被一些程序员“骚扰”,说是请教一些关于FushionChart Free图表的处理技术,先前还是比较乐意接受的,但发现后来一些完全不想自己做只是想打时间而已,几天过去一点进展都没,实属无奈才整理编写这篇博客直接给链接给他们来的方便[此篇博客纯属参考有错误指出希望指出]
FusionCharts Free是一个制图组件用于创建好看,数据驱动,拥有动画效果的Flash charts。它能够与PHP、Python、Ruby on Rails、ASP、ASP.NET、JSP、ColdFusion、HTML页面等一起使用。这个组件是FusionCharts的免费版,但功能仍然很强大。它能够生成的图表类型包括:
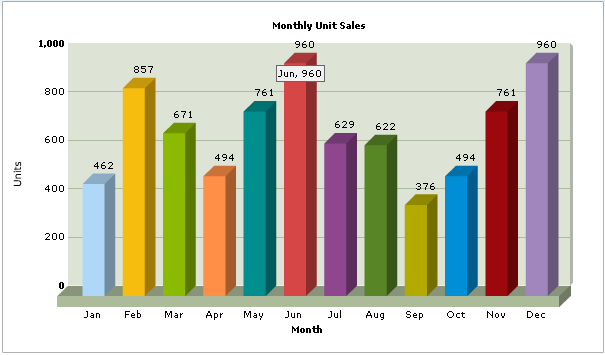
- 2D/3D column & bar charts
- 2D/3D pie & doughnut charts
- Line charts
- Area charts
- Stacked charts
- Gantt charts
一下一这几种图表为例:
首先了解这个插件的的基本文件的一些目录结构
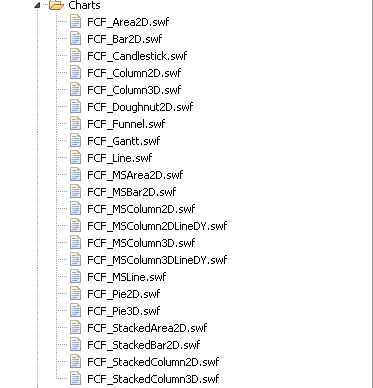
SWF文件 控制3D动画来实现数据加载和显示
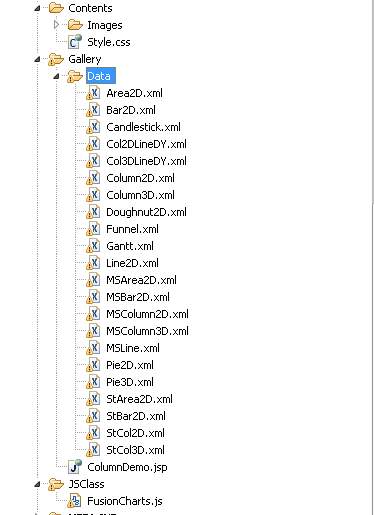
Style.css有兴趣或者想改变那些原有的样式可以尝试着写修改
Style.css


  1 .pageHeader{
  2     COLOR: #291E40;
  3     FONT-FAMILY: Verdana;
  4     FONT-WEIGHT: bold;
  5     FONT-SIZE: 12pt;
  6 }
  7 .header
  8 {
  9     COLOR: #291E40;
 10     FONT-FAMILY: Verdana;
 11     FONT-WEIGHT: bold;
 12     FONT-SIZE: 9pt;
 13
 14 }
 15 .headerwhite
 16 {
 17     COLOR: #FFFFFF;
 18     FONT-FAMILY: Verdana;
 19     FONT-WEIGHT: bold;
 20     FONT-SIZE: 11px;
 21
 22 }
 23 .headingtable
 24 {
 25     COLOR: #FFCC00;
 26     FONT-FAMILY: Verdana;
 27     FONT-SIZE: 9pt;
 28     FONT-WEIGHT: bold;
 29
 30     PADDING-TOP: 5px;
 31     PADDING-BOTTOM: 5px;
 32 }
 33 .text
 34 {
 35     COLOR: #291E40;
 36     FONT-FAMILY: Verdana;
 37     FONT-SIZE: 8pt;
 38
 39 }
 40 .textBold
 41 {
 42     COLOR: #291E40;
 43     FONT-FAMILY: Verdana;
 44     FONT-SIZE: 8pt;
 45
 46     FONT-WEIGHT: bold;
 47 }
 48 .textwhite
 49 {
 50     COLOR: #FFFFFF;
 51     FONT-FAMILY: Verdana;
 52     FONT-SIZE: 8pt;
 53     FONT-WEIGHT: bold;
 54
 55 }
 56 .highlightBlock{
 57     BACKGROUND: #F1F1F1;
 58     COLOR: #291E40;
 59     BORDER: 1px solid #291E40;
 60     FONT-FAMILY: Verdana;
 61     FONT-SIZE: 8pt;
 62
 63     PADDING: 10px;
 64 }
 65 .imageCaption
 66 {
 67     COLOR: #291E40;
 68     FONT-FAMILY: Verdana;
 69     FONT-SIZE: 8pt;
 70
 71 }
 72 .imageBorder
 73 {
 74     BORDER: 1px solid #f1f1f1;
 75 }
 76 .codeBlock
 77 {
 78     BACKGROUND: #FFFCF0;
 79     COLOR: #291E40;
 80     FONT-FAMILY: Courier New;
 81     FONT-SIZE: 12px;
 82
 83     PADDING: 10px;
 84 }
 85 .codeComment
 86 {
 87     COLOR: #007F00;
 88 }
 89
 90 .codeInline
 91 {
 92     COLOR: #291E40;
 93     FONT-FAMILY: Courier New;
 94     FONT-SIZE: 12px;
 95
 96 }
 97 .A
 98 {
 99     COLOR: #291E40;
100     FONT-FAMILY: Verdana;
101     FONT-SIZE: 8pt;
102
103     FONT-WEIGHT: bold;
104
105 }
106 .A:hover
107 {
108     COLOR: #FFA000;
109 }
110 A
111 {
112     COLOR: #291E40;
113
114 }
115 A:hover
116 {
117     COLOR: #FFA000;
118 }
119 .trVeryLightYellowBg
120 {
121     BACKGROUND: #FFFCF0;
122 }
123 .lightBlueTr
124 {
125     BACKGROUND: #E0E9ED;
126     BORDER-RIGHT:1px solid #94B0BE;
127     BORDER-BOTTOM:1px solid #94B0BE;
128     FONT-FAMILY: Verdana;
129     FONT-SIZE: 8pt;
130
131 }
132 .greyBorderTable
133 {
134     BORDER: 1px solid #f1f1f1;
135 }
136 .yellowBorderTable
137 {
138     BORDER: 1px solid #FCCC22;
139 }
140
141 .blueTr
142 {
143     BACKGROUND: #94B0BE;
144     FONT-FAMILY: Verdana;
145     FONT-SIZE: 8pt;
146
147 }
148 .greyTr
149 {
150     BACKGROUND: #F1f1f1;
151 }
152 .darkGreyTr
153 {
154     BACKGROUND: #999999;
155 }
156 .darkYellowTr
157 {
158     BACKGROUND: #FCCC22;
159 }
160 .lightYellowTr
161 {
162     BACKGROUND: #FEECB4;
163 }
164 .formtable
165 {
166     COLOR: #291E40;
167     FONT-FAMILY: Verdana;
168     FONT-SIZE: 8pt;
169
170     FONT-WEIGHT:none;
171 }
172 .textbox
173 {
174     BACKGROUND: #F8F8F8;
175     BORDER: 1px solid #999999;
176     COLOR: #999999;
177     FONT-FAMILY: Verdana;
178     FONT-SIZE: 11px;
179
180 }
181
182 .button
183 {
184     BACKGROUND: #F8F8F8;
185     BORDER: 1px solid #999999;
186     COLOR: #999999;
187     FONT-FAMILY: Verdana;
188     FONT-SIZE: 11px;
189
190     FONT-WEIGHT: bold;
191 }
192
193 .borderBottom {
194 border-bottom:1px solid #cccccc;
195 }
XML文件呢,已上诉三种为例:[是数据来源,方案一:我们可以采用动态生成XML的形式来实现数据的动态显示,方案二:后面会讲到]
Column3D.xml
 1 <graph caption='Monthly Unit Sales' xAxisName='Month' yAxisName='Units' decimalPrecision='0' formatNumberScale='0'>
 2 <set name='Jan' value='462' color='AFD8F8' />
 3 <set name='Feb' value='857' color='F6BD0F' />
 4 <set name='Mar' value='671' color='8BBA00' />
 5 <set name='Apr' value='494' color='FF8E46'/>
 6 <set name='May' value='761' color='008E8E'/>
 7 <set name='Jun' value='960' color='D64646'/>
 8 <set name='Jul' value='629' color='8E468E'/>
 9 <set name='Aug' value='622' color='588526'/>
10 <set name='Sep' value='376' color='B3AA00'/>
11 <set name='Oct' value='494' color='008ED6'/>
12 <set name='Nov' value='761' color='9D080D'/>
13 <set name='Dec' value='960' color='A186BE'/>
14 </graph>
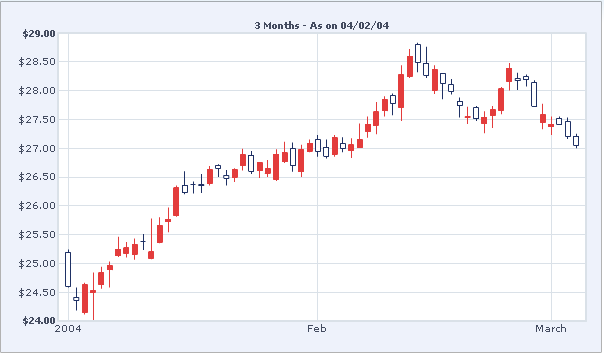
Candlestick.xml
 1 <graph caption='3 Months - As on 04/02/04' yAxisMinValue='24' yAxisMaxValue='29'
 2 canvasBorderColor='DAE1E8' canvasBgColor='FFFFFF' bgColor='EEF2FB'
 3 numDivLines='9' divLineColor='DAE1E8' decimalPrecision='2' numberPrefix='$' showNames='1' bearBorderColor='E33C3C' bearFillColor='E33C3C' bullBorderColor='1F3165' baseFontColor='444C60' outCnvBaseFontColor='444C60' hoverCapBorderColor='DAE1E8' hoverCapBgColor='FFFFFF' rotateNames='0'>
 4
 5 <categories font='' fontSize='10' fontColor='' verticalLineColor='' verticalLineThickness='1' verticalLineAlpha='100'>
 6 <category Name='2004' xIndex='1' showLine='1'/>
 7 <category Name='Feb' xIndex='31' showLine='1'/>
 8 <category Name='March' xIndex='59' showLine='1'/>
 9 </categories>
10
11 <data>
12 <set open='24.6' high='25.24' low='24.58' close='25.19' />
13 <set open='24.36' high='24.58' low='24.18' close='24.41' />
14 <set open='24.63' high='24.66' low='24.11' close='24.15' />
15 <set open='24.53' high='24.84' low='24.01' close='24.5' />
16 <set open='24.84' high='24.94' low='24.56' close='24.63' />
17 <set open='24.96' high='25.03' low='24.58' close='24.89' />
18 <set open='25.25' high='25.46' low='25.11' close='25.13' />
19 <set open='25.27' high='25.37' low='25.0999' close='25.18' />
20 <set open='25.33' high='25.43' low='25.06' close='25.16' />
21 <set open='25.38' high='25.51' low='25.23' close='25.38' />
22 <set open='25.2' high='25.78' low='25.07' close='25.09' />
23 <set open='25.66' high='25.8' low='25.35' close='25.37' />
24 <set open='25.77' high='25.97' low='25.54' close='25.72' />
25 <set open='26.31' high='26.35' low='25.81' close='25.83' />
26 <set open='26.23' high='26.6' low='26.2' close='26.35' />
27 <set open='26.37' high='26.42' low='26.21' close='26.37' />
28 <set open='26.35' high='26.55' low='26.22' close='26.37' />
29 <set open='26.63' high='26.69' low='26.35' close='26.39' />
30 <set open='26.65' high='26.72' low='26.5' close='26.7' />
31 <set open='26.48' high='26.62' low='26.35' close='26.53' />
32 <set open='26.63' high='26.65' low='26.41' close='26.5' />
33 <set open='26.89' high='26.99' low='26.61' close='26.7' />
34 <set open='26.6' high='26.95' low='26.55' close='26.88' />
35 <set open='26.75' high='26.76' low='26.4799' close='26.61' />
36 <set open='26.65' high='26.795' low='26.5' close='26.57' />
37 <set open='26.9' high='26.98' low='26.43' close='26.46' />
38 <set open='26.92' high='27.11' low='26.74' close='26.77' />
39 <set open='26.7' high='27.1' low='26.59' close='26.99' />
40 <set open='26.98' high='27.06' low='26.5' close='26.59' />
41 <set open='27.09' high='27.15' low='26.93' close='26.95' />
42 <set open='26.95' high='27.23' low='26.85' close='27.15' />
43 <set open='26.86' high='27.15' low='26.82' close='27.02' />
44 <set open='27.18' high='27.229' low='26.85' close='26.9' />
45 <set open='27' high='27.19' low='26.93' close='27.08' />
46 <set open='27.06' high='27.17' low='26.83' close='26.96' />
47 <set open='27.15' high='27.43' low='27.01' close='27.01' />
48 <set open='27.42' high='27.55' low='27.18' close='27.29' />
49 <set open='27.63' high='27.8' low='27.24' close='27.4' />
50 <set open='27.85' high='27.9' low='27.55' close='27.65' />
51 <set open='27.78' high='27.95' low='27.57' close='27.91' />
52 <set open='28.28' high='28.44' low='27.47' close='27.71' />
53 <set open='28.6' high='28.72' low='28.22' close='28.25' />
54 <set open='28.49' high='28.83' low='28.32' close='28.8' />
55 <set open='28.27' high='28.76' low='28.22' close='28.48' />
56 <set open='28.37' high='28.44' low='27.94' close='28.01' />
57 <set open='28.13' high='28.3' low='27.85' close='28.3' />
58 <set open='27.99' high='28.2' low='27.93' close='28.1' />
59 <set open='27.74' high='27.88' low='27.53' close='27.81' />
60 <set open='27.55' high='27.72' low='27.42' close='27.54' />
61 <set open='27.51' high='27.73' low='27.47' close='27.7' />
62 <set open='27.54' high='27.64' low='27.26' close='27.43' />
63 <set open='27.67' high='27.73' low='27.35' close='27.57' />
64 <set open='28.03' high='28.061' low='27.59' close='27.66' />
65 <set open='28.39' high='28.48' low='28' close='28.16' />
66 <set open='28.17' high='28.31' low='28.01' close='28.21' />
67 <set open='28.19' high='28.28' low='28.07' close='28.24' />
68 <set open='27.73' high='28.18' low='27.72' close='28.14' />
69 <set open='27.58' high='27.77' low='27.33' close='27.45' />
70 <set open='27.42' high='27.55' low='27.23' close='27.37' />
71 <set open='27.41' high='27.55' low='27.4' close='27.52' />
72 <set open='27.21' high='27.53' low='27.16' close='27.46' />
73 <set open='27.05' high='27.25' low='27' close='27.21' />
74
75 </data>
76 </graph>
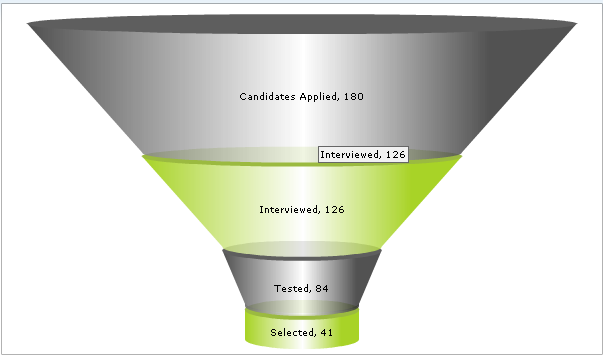
Funnel.xml
1 <chart isSliced='1' slicingDistance='4' decimalPrecision='0'>
2     <set name='Selected' value='41' color='99CC00' alpha='85'/>
3     <set name='Tested' value='84' color='333333' alpha='85'/>
4     <set name='Interviewed' value='126' color='99CC00'  alpha='85'/>
5     <set name='Candidates Applied' value='180' color='333333' alpha='85'/>
6 </chart>
FusionCharts.js是这个插件的主要Juqey,Jquery的调用方法都在这个文件里
  1 /**
  2  * FusionCharts: Flash Player detection and Chart embedding.
  3  * Version 1.2.3F ( 22 November 2008) - Specialized for FusionChartsFREE
  4  *                     Checking Flash Version >=6 and added updateChartXML() for FREE Charts.
  5  * Version: 1.2.3 (1st September, 2008) - Added Fix for % and & characters, scaled dimensions, fixes in to properly handling of double quotes and single quotes in setDataXML() function.
  6  * Version: 1.2.2 (10th July, 2008) - Added Fix for % scaled dimensions, fixes in setDataXML() and setDataURL() functions
  7  * Version: 1.2.1 (21st December, 2007) - Added setting up Transparent/opaque mode: setTransparent() function
  8  * Version: 1.2 (1st November, 2007) - Added FORM fixes for IE
  9  * Version: 1.1 (29th June, 2007) - Added Player detection, New conditional fixes for IE
 10  *
 11  * Morphed from SWFObject (http://blog.deconcept.com/swfobject/) under MIT License:
 12  * http://www.opensource.org/licenses/mit-license.php
 13  *
 14  */
 15 if(typeof infosoftglobal == "undefined") var infosoftglobal = new Object();
 16 if(typeof infosoftglobal.FusionChartsUtil == "undefined") infosoftglobal.FusionChartsUtil = new Object();
 17 infosoftglobal.FusionCharts = function(swf, id, w, h, debugMode, registerWithJS, c, scaleMode, lang, detectFlashVersion, autoInstallRedirect){
 18     if (!document.getElementById) { return; }
 19
 20     //Flag to see whether data has been set initially
 21     this.initialDataSet = false;
 22
 23     //Create container objects
 24     this.params = new Object();
 25     this.variables = new Object();
 26     this.attributes = new Array();
 27
 28     //Set attributes for the SWF
 29     if(swf) { this.setAttribute('swf', swf); }
 30     if(id) { this.setAttribute('id', id); }
 31
 32     w=w.toString().replace(/\%$/,"%25");
 33     if(w) { this.setAttribute('width', w); }
 34     h=h.toString().replace(/\%$/,"%25");
 35     if(h) { this.setAttribute('height', h); }
 36
 37
 38     //Set background color
 39     if(c) { this.addParam('bgcolor', c); }
 40
 41     //Set Quality
 42     this.addParam('quality', 'high');
 43
 44     //Add scripting access parameter
 45     this.addParam('allowScriptAccess', 'always');
 46
 47     //Pass width and height to be appended as chartWidth and chartHeight
 48     this.addVariable('chartWidth', w);
 49     this.addVariable('chartHeight', h);
 50
 51     //Whether in debug mode
 52     debugMode = debugMode ? debugMode : 0;
 53     this.addVariable('debugMode', debugMode);
 54     //Pass DOM ID to Chart
 55     this.addVariable('DOMId', id);
 56     //Whether to registed with JavaScript
 57     registerWithJS = registerWithJS ? registerWithJS : 0;
 58     this.addVariable('registerWithJS', registerWithJS);
 59
 60     //Scale Mode of chart
 61     scaleMode = scaleMode ? scaleMode : 'noScale';
 62     this.addVariable('scaleMode', scaleMode);
 63
 64     //Application Message Language
 65     lang = lang ? lang : 'EN';
 66     this.addVariable('lang', lang);
 67
 68     //Whether to auto detect and re-direct to Flash Player installation
 69     this.detectFlashVersion = detectFlashVersion?detectFlashVersion:1;
 70     this.autoInstallRedirect = autoInstallRedirect?autoInstallRedirect:1;
 71
 72     //Ger Flash Player version
 73     this.installedVer = infosoftglobal.FusionChartsUtil.getPlayerVersion();
 74
 75     if (!window.opera && document.all && this.installedVer.major > 7) {
 76         // Only add the onunload cleanup if the Flash Player version supports External Interface and we are in IE
 77         infosoftglobal.FusionCharts.doPrepUnload = true;
 78     }
 79 }
 80
 81 infosoftglobal.FusionCharts.prototype = {
 82     setAttribute: function(name, value){
 83         this.attributes[name] = value;
 84     },
 85     getAttribute: function(name){
 86         return this.attributes[name];
 87     },
 88     addParam: function(name, value){
 89         this.params[name] = value;
 90     },
 91     getParams: function(){
 92         return this.params;
 93     },
 94     addVariable: function(name, value){
 95         this.variables[name] = value;
 96     },
 97     getVariable: function(name){
 98         return this.variables[name];
 99     },
100     getVariables: function(){
101         return this.variables;
102     },
103     getVariablePairs: function(){
104         var variablePairs = new Array();
105         var key;
106         var variables = this.getVariables();
107         for(key in variables){
108             variablePairs.push(key +"="+ variables[key]);
109         }
110         return variablePairs;
111     },
112     getSWFHTML: function() {
113         var swfNode = "";
114         if (navigator.plugins && navigator.mimeTypes && navigator.mimeTypes.length) {
115             // netscape plugin architecture
116             swfNode = '<embed type="application/x-shockwave-flash" src="'+ this.getAttribute('swf') +'" width="'+ this.getAttribute('width') +'" height="'+ this.getAttribute('height') +'"  ';
117             swfNode += ' id="'+ this.getAttribute('id') +'" name="'+ this.getAttribute('id') +'" ';
118             var params = this.getParams();
119              for(var key in params){ swfNode += [key] +'="'+ params[key] +'" '; }
120             var pairs = this.getVariablePairs().join("&");
121              if (pairs.length > 0){ swfNode += 'flashvars="'+ pairs +'"'; }
122             swfNode += '/>';
123         } else { // PC IE
124             swfNode = '<object id="'+ this.getAttribute('id') +'" classid="clsid:D27CDB6E-AE6D-11cf-96B8-444553540000" width="'+ this.getAttribute('width') +'" height="'+ this.getAttribute('height') +'">';
125             swfNode += '<param name="movie" value="'+ this.getAttribute('swf') +'" />';
126             var params = this.getParams();
127             for(var key in params) {
128              swfNode += '<param name="'+ key +'" value="'+ params[key] +'" />';
129             }
130             var pairs = this.getVariablePairs().join("&");
131             if(pairs.length > 0) {swfNode += '<param name="flashvars" value="'+ pairs +'" />';}
132             swfNode += "</object>";
133         }
134         return swfNode;
135     },
136     setDataURL: function(strDataURL){
137         //This method sets the data URL for the chart.
138         //If being set initially
139         if (this.initialDataSet==false){
140             this.addVariable('dataURL',strDataURL);
141             //Update flag
142             this.initialDataSet = true;
143         }else{
144             //Else, we update the chart data using External Interface
145             //Get reference to chart object
146             var chartObj = infosoftglobal.FusionChartsUtil.getChartObject(this.getAttribute('id'));
147
148             if (!chartObj.setDataURL)
149             {
150                 __flash__addCallback(chartObj, "setDataURL");
151             }
152
153             chartObj.setDataURL(strDataURL);
154         }
155     },
156     //This function :
157     //fixes the double quoted attributes to single quotes
158     //Encodes all quotes inside attribute values
159     //Encodes % to %25 and & to %26;
160     encodeDataXML: function(strDataXML){
161
162             var regExpReservedCharacters=["\$","\+"];
163             var arrDQAtt=strDataXML.match(/=s*".*?"/g);
164             if (arrDQAtt){
165                 for(var i=0;i<arrDQAtt.length;i++){
166                     var repStr=arrDQAtt[i].replace(/^=s*"|"$/g,"");
167                     repStr=repStr.replace(/'/g,"%26apos;");
168                     var strTo=strDataXML.indexOf(arrDQAtt[i]);
169                     var repStrr="='"+repStr+"'";
170                     var strStart=strDataXML.substring(0,strTo);
171                     var strEnd=strDataXML.substring(strTo+arrDQAtt[i].length);
172                     var strDataXML=strStart+repStrr+strEnd;
173                 }
174             }
175
176             strDataXML=strDataXML.replace(/"/g,"%26quot;");
177             strDataXML=strDataXML.replace(/%(?![da-f]{2}|[da-f]{4})/ig,"%25");
178             strDataXML=strDataXML.replace(/&/g,"%26");
179
180             return strDataXML;
181
182     },
183     setDataXML: function(strDataXML){
184         //If being set initially
185         if (this.initialDataSet==false){
186             //This method sets the data XML for the chart INITIALLY.
187             this.addVariable('dataXML',this.encodeDataXML(strDataXML));
188             //Update flag
189             this.initialDataSet = true;
190         }else{
191             //Else, we update the chart data using External Interface
192             //Get reference to chart object
193             var chartObj = infosoftglobal.FusionChartsUtil.getChartObject(this.getAttribute('id'));
194             chartObj.setDataXML(strDataXML);
195         }
196     },
197     setTransparent: function(isTransparent){
198         //Sets chart to transparent mode when isTransparent is true (default)
199         //When no parameter is passed, we assume transparent to be true.
200         if(typeof isTransparent=="undefined") {
201             isTransparent=true;
202         }
203         //Set the property
204         if(isTransparent)
205             this.addParam('WMode', 'transparent');
206         else
207             this.addParam('WMode', 'Opaque');
208     },
209
210     render: function(elementId){
211         //First check for installed version of Flash Player - we need a minimum of 6
212         if((this.detectFlashVersion==1) && (this.installedVer.major < 6)){
213             if (this.autoInstallRedirect==1){
214                 //If we can auto redirect to install the player?
215                 var installationConfirm = window.confirm("You need Adobe Flash Player 6 (or above) to view the charts. It is a free and lightweight installation from Adobe.com. Please click on Ok to install the same.");
216                 if (installationConfirm){
217                     window.location = "http://www.adobe.com/shockwave/download/download.cgi?P1_Prod_Version=ShockwaveFlash";
218                 }else{
219                     return false;
220                 }
221             }else{
222                 //Else, do not take an action. It means the developer has specified a message in the DIV (and probably a link).
223                 //So, expect the developers to provide a course of way to their end users.
224                 //window.alert("You need Adobe Flash Player 8 (or above) to view the charts. It is a free and lightweight installation from Adobe.com. ");
225                 return false;
226             }
227         }else{
228             //Render the chart
229             var n = (typeof elementId == 'string') ? document.getElementById(elementId) : elementId;
230             n.innerHTML = this.getSWFHTML();
231
232             //Added <FORM> compatibility
233             //Check if it's added in Mozilla embed array or if already exits
234             if(!document.embeds[this.getAttribute('id')] && !window[this.getAttribute('id')])
235                   window[this.getAttribute('id')]=document.getElementById(this.getAttribute('id'));
236                 //or else document.forms[formName/formIndex][chartId]
237             return true;
238         }
239     }
240 }
241
242 /* ---- detection functions ---- */
243 infosoftglobal.FusionChartsUtil.getPlayerVersion = function(){
244     var PlayerVersion = new infosoftglobal.PlayerVersion([0,0,0]);
245     if(navigator.plugins && navigator.mimeTypes.length){
246         var x = navigator.plugins["Shockwave Flash"];
247         if(x && x.description) {
248             PlayerVersion = new infosoftglobal.PlayerVersion(x.description.replace(/([a-zA-Z]|s)+/, "").replace(/(s+r|s+b[0-9]+)/, ".").split("."));
249         }
250     }else if (navigator.userAgent && navigator.userAgent.indexOf("Windows CE") >= 0){
251         //If Windows CE
252         var axo = 1;
253         var counter = 3;
254         while(axo) {
255             try {
256                 counter++;
257                 axo = new ActiveXObject("ShockwaveFlash.ShockwaveFlash."+ counter);
258                 PlayerVersion = new infosoftglobal.PlayerVersion([counter,0,0]);
259             } catch (e) {
260                 axo = null;
261             }
262         }
263     } else {
264         // Win IE (non mobile)
265         // Do minor version lookup in IE, but avoid Flash Player 6 crashing issues
266         try{
267             var axo = new ActiveXObject("ShockwaveFlash.ShockwaveFlash.7");
268         }catch(e){
269             try {
270                 var axo = new ActiveXObject("ShockwaveFlash.ShockwaveFlash.6");
271                 PlayerVersion = new infosoftglobal.PlayerVersion([6,0,21]);
272                 axo.AllowScriptAccess = "always"; // error if player version < 6.0.47 (thanks to Michael Williams @ Adobe for this code)
273             } catch(e) {
274                 if (PlayerVersion.major == 6) {
275                     return PlayerVersion;
276                 }
277             }
278             try {
279                 axo = new ActiveXObject("ShockwaveFlash.ShockwaveFlash");
280             } catch(e) {}
281         }
282         if (axo != null) {
283             PlayerVersion = new infosoftglobal.PlayerVersion(axo.GetVariable("$version").split(" ")[1].split(","));
284         }
285     }
286     return PlayerVersion;
287 }
288 infosoftglobal.PlayerVersion = function(arrVersion){
289     this.major = arrVersion[0] != null ? parseInt(arrVersion[0]) : 0;
290     this.minor = arrVersion[1] != null ? parseInt(arrVersion[1]) : 0;
291     this.rev = arrVersion[2] != null ? parseInt(arrVersion[2]) : 0;
292 }
293 // ------------ Fix for Out of Memory Bug in IE in FP9 ---------------//
294 /* Fix for video streaming bug */
295 infosoftglobal.FusionChartsUtil.cleanupSWFs = function() {
296     var objects = document.getElementsByTagName("OBJECT");
297     for (var i = objects.length - 1; i >= 0; i--) {
298         objects[i].style.display = 'none';
299         for (var x in objects[i]) {
300             if (typeof objects[i][x] == 'function') {
301                 objects[i][x] = function(){};
302             }
303         }
304     }
305 }
306 // Fixes bug in fp9
307 if (infosoftglobal.FusionCharts.doPrepUnload) {
308     if (!infosoftglobal.unloadSet) {
309         infosoftglobal.FusionChartsUtil.prepUnload = function() {
310             __flash_unloadHandler = function(){};
311             __flash_savedUnloadHandler = function(){};
312             window.attachEvent("onunload", infosoftglobal.FusionChartsUtil.cleanupSWFs);
313         }
314         window.attachEvent("onbeforeunload", infosoftglobal.FusionChartsUtil.prepUnload);
315         infosoftglobal.unloadSet = true;
316     }
317 }
318 /* Add document.getElementById if needed (mobile IE < 5) */
319 if (!document.getElementById && document.all) { document.getElementById = function(id) { return document.all[id]; }}
320 /* Add Array.push if needed (ie5) */
321 if (Array.prototype.push == null) { Array.prototype.push = function(item) { this[this.length] = item; return this.length; }}
322
323 /* Function to return Flash Object from ID */
324 infosoftglobal.FusionChartsUtil.getChartObject = function(id)
325 {
326   var chartRef=null;
327   if (navigator.appName.indexOf("Microsoft Internet")==-1) {
328     if (document.embeds && document.embeds[id])
329       chartRef = document.embeds[id];
330     else
331     chartRef  = window.document[id];
332   }
333   else {
334     chartRef = window[id];
335   }
336   if (!chartRef)
337     chartRef  = document.getElementById(id);
338
339   return chartRef;
340 }
341 /*
342  Function to update chart's data at client side (FOR FusionCharts vFREE and 2.x
343 */
344 infosoftglobal.FusionChartsUtil.updateChartXML = function(chartId, strXML){
345     //Get reference to chart object
346     var chartObj = infosoftglobal.FusionChartsUtil.getChartObject(chartId);
347     //Set dataURL to null
348     chartObj.SetVariable("_root.dataURL","");
349     //Set the flag
350     chartObj.SetVariable("_root.isNewData","1");
351     //Set the actual data
352     chartObj.SetVariable("_root.newData",strXML);
353     //Go to the required frame
354     chartObj.TGotoLabel("/", "JavaScriptHandler");
355 }
356
357
358 /* Aliases for easy usage */
359 var getChartFromId = infosoftglobal.FusionChartsUtil.getChartObject;
360 var updateChartXML = infosoftglobal.FusionChartsUtil.updateChartXML;
361 var FusionCharts = infosoftglobal.FusionCharts;
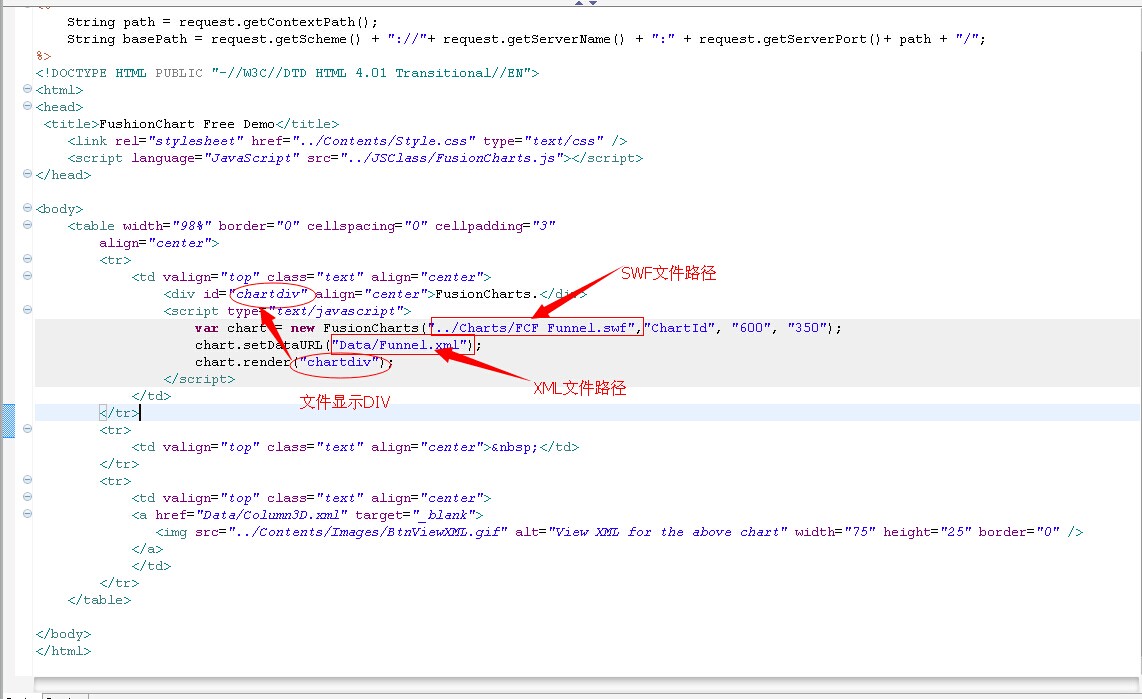
1 <script type="text/javascript">
2     var chart = new  FusionCharts("../Charts/FCF_Funnel.swf",
3                                   "ChartId", "600", "350");
4     chart.setDataURL("Data/Funnel.xml");
5     chart.render("chartdiv");
6 </script>
是前端调用的基本方法
FusionCharts("")里的参数分别对应于 上诉改图表对应SWF文件路径,在FusionCharts.js的标示,图表的长和宽
chart.setDataURL("")图表对应的XML文件
JSP文件
JSP
1 <%@ page language="java" import="java.util.*" pageEncoding="ISO-8859-1"%> 2 <% 3 String path = request.getContextPath(); 4 String basePath = request.getScheme() + "://"+ request.getServerName() + ":" + request.getServerPort()+ path + "/"; 5 %> 6 <!DOCTYPE HTML PUBLIC "-//W3C//DTD HTML 4.01 Transitional//EN"> 7 <html> 8 <head> 9 <title>FushionChart Free Demo</title> 10 <link rel="stylesheet" href="../Contents/Style.css" type="text/css" /> 11 <script language="JavaScript" src="../JSClass/FusionCharts.js"></script> 12 </head> 13 14 <body> 15 <table width="98%" border="0" cellspacing="0" cellpadding="3" 16 align="center"> 17 <tr> 18 <td valign="top" class="text" align="center"> 19 <div id="chartdiv" align="center">FusionCharts.</div> 20 <script type="text/javascript"> 21 var chart = new FusionCharts("../Charts/FCF_Funnel.swf","ChartId", "600", "350"); 22 chart.setDataURL("Data/Funnel.xml"); 23 chart.render("chartdiv"); 24 </script> 25 </td> 26 </tr> 27 <tr> 28 <td valign="top" class="text" align="center"> </td> 29 </tr> 30 <tr> 31 <td valign="top" class="text" align="center"> 32 <a href="Data/Column3D.xml" target="_blank"> 33 <img src="../Contents/Images/BtnViewXML.gif" alt="View XML for the above chart" width="75" height="25" border="0" /> 34 </a> 35 </td> 36 </tr> 37 </table> 38 39 </body> 40 </html>
当然我们现在做系统都是要动态实现数据的更新所以呢,添加数据的形式都会不一样,但是原理都是一样的-->编写XML文件或者XML的字符串
前面提到一种实现方案下面全总结下:
方案一:获取数据来源,将数据动态添加到XML文件中,当然这种方法会生成许多零时的XML文件,对文件名和文件路径要把握好,因为在JSP端我们要将XML文件的“完整”路径;
方案二:直接将数据添加到一需要图表对应的“XML文件”里,这里的XML文件指的是字符串,"XML字符串“必须按照对应的XML格式来编写,然后将数据放到作用域中给前台调用显示
(当然这里会出现缓存问题,目前本人的解决方案是直接放到影藏文本域中,在用Jquery调用显示)
下面是共享地址:有什么错误的地方欢迎加入群交流(131874993)
有源码和一个Demo
http://yunpan.cn/Qa99jaXZhejmH (提取码:1634)