Echarts是由百度提供的数据可视化解决方案, 可以让我们快速实现功能丰富的图表,官网链接
使用方法
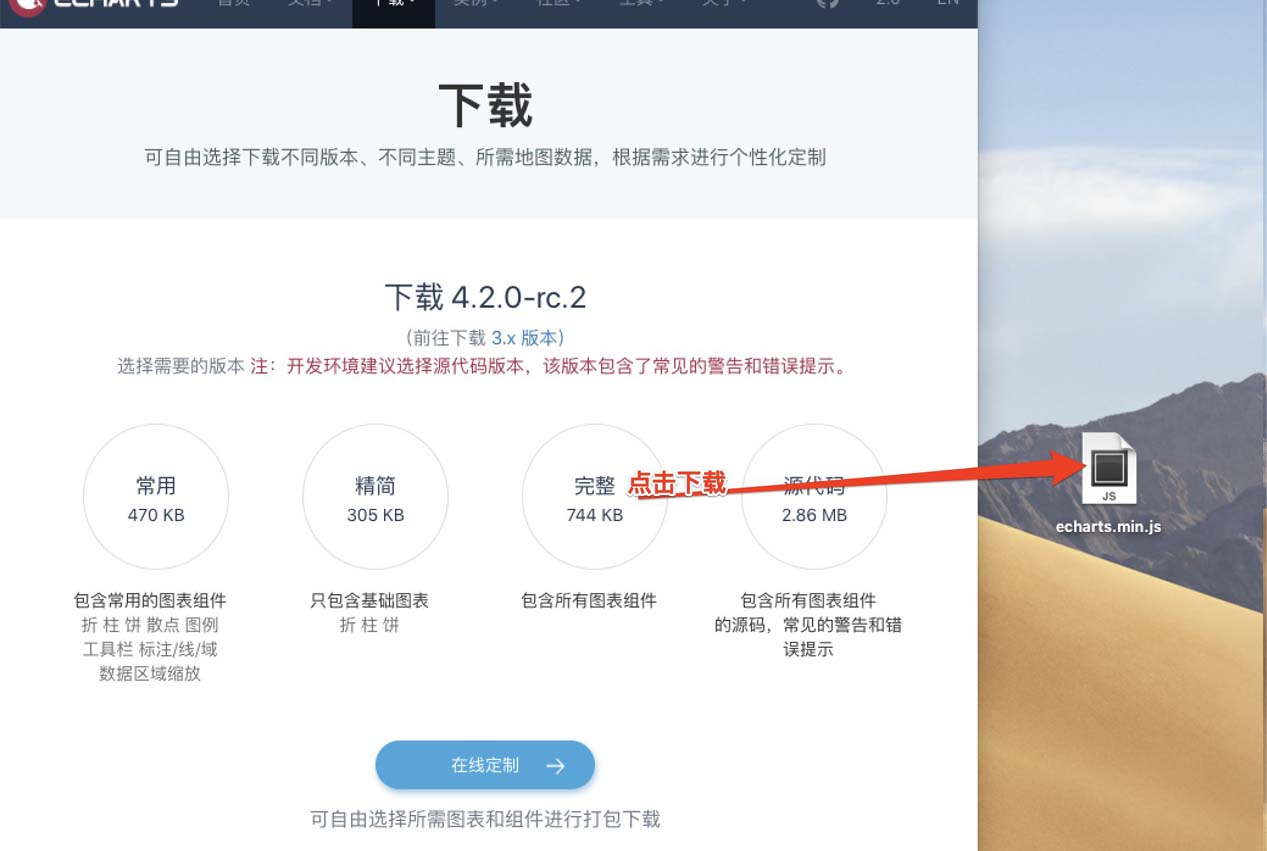
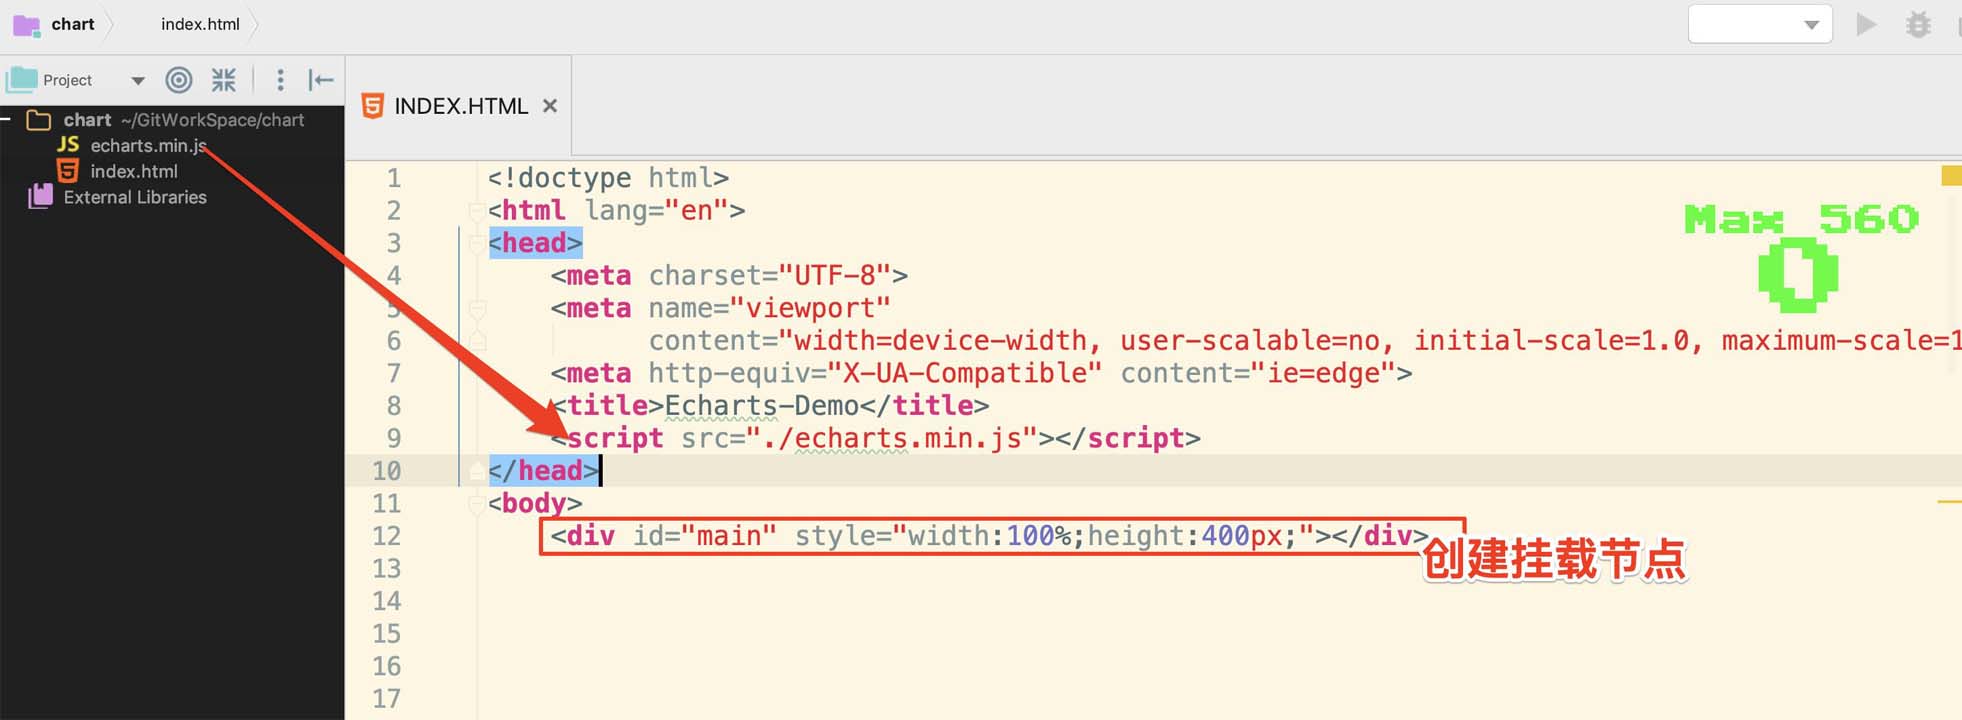
1.引入echarts.min.js文件
下载echarts.min.js文件,下载地址
创建一个挂载节点
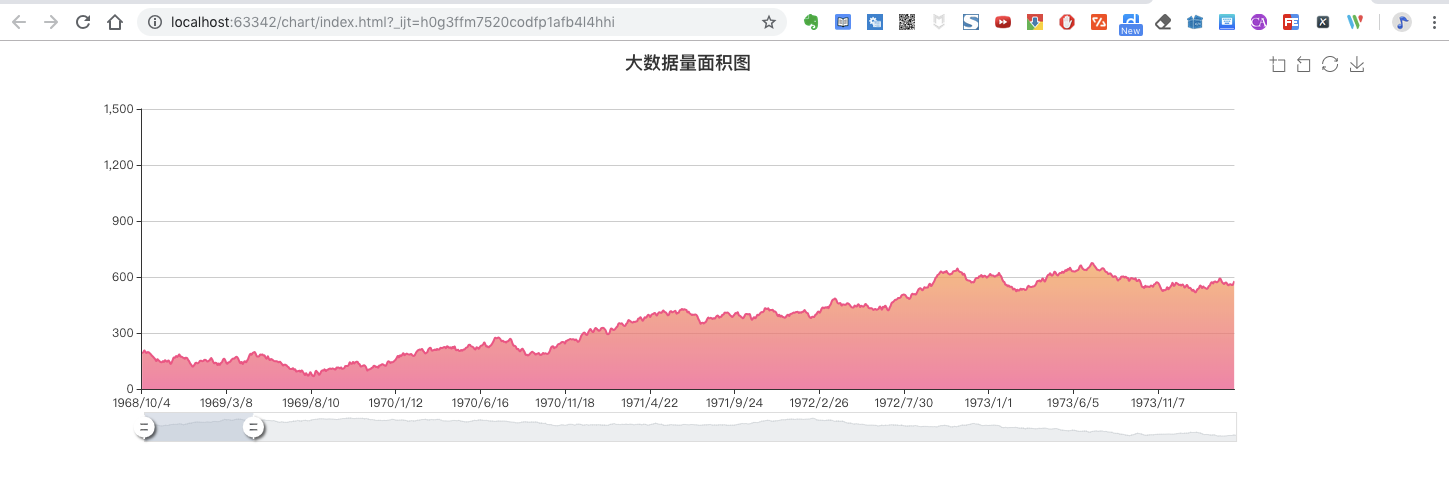
将数据展示到挂载节点
生成数据, 并将数据导入到option配置对象中
|
1
2
3
4
5
6
7
8
9
10
11
12
13
14
15
16
17
18
19
20
21
22
23
24
25
26
27
28
29
30
31
32
33
34
35
36
37
38
39
40
41
42
43
44
45
46
47
48
49
50
51
52
53
54
55
56
57
58
59
60
61
62
63
64
65
66
67
68
69
70
71
72
73
74
75
76
77
78
79
80
81
82
83
|
// 创建数据var base = +new Date(1968, 9, 3);var oneDay = 24 * 3600 * 1000;var date = [];var data = [Math.random() * 300];for (var i = 1; i < 20000; i++) { var now = new Date(base += oneDay); date.push([now.getFullYear(), now.getMonth() + 1, now.getDate()].join('/')); data.push(Math.round((Math.random() - 0.5) * 20 + data[i - 1]));}// 创建对象optionoption = { tooltip: { trigger: 'axis', position: function (pt) { return [pt[0], '10%']; } }, title: { left: 'center', text: '大数据量面积图', }, toolbox: { feature: { dataZoom: { yAxisIndex: 'none' }, restore: {}, saveAsImage: {} } }, xAxis: { type: 'category', boundaryGap: false, data: date }, yAxis: { type: 'value', boundaryGap: [0, '100%'] }, dataZoom: [{ type: 'inside', start: 0, end: 10 }, { start: 0, end: 10, handleIcon: 'M10.7,11.9v-1.3H9.3v1.3c-4.9,0.3-8.8,4.4-8.8,9.4c0,5,3.9,9.1,8.8,9.4v1.3h1.3v-1.3c4.9-0.3,8.8-4.4,8.8-9.4C19.5,16.3,15.6,12.2,10.7,11.9z M13.3,24.4H6.7V23h6.6V24.4z M13.3,19.6H6.7v-1.4h6.6V19.6z', handleSize: '80%', handleStyle: { color: '#fff', shadowBlur: 3, shadowColor: 'rgba(0, 0, 0, 0.6)', shadowOffsetX: 2, shadowOffsetY: 2 } }], series: [ { name:'模拟数据', type:'line', smooth:true, symbol: 'none', sampling: 'average', itemStyle: { color: 'rgb(255, 70, 131)' }, areaStyle: { color: new echarts.graphic.LinearGradient(0, 0, 0, 1, [{ offset: 0, color: 'rgb(255, 158, 68)' }, { offset: 1, color: 'rgb(255, 70, 131)' }]) }, data: data } ]}; |
将option添加到挂载节点
|
1
2
|
// 将option数据挂载到main节点echarts.init(document.getElementById('main')).setOption(option); |
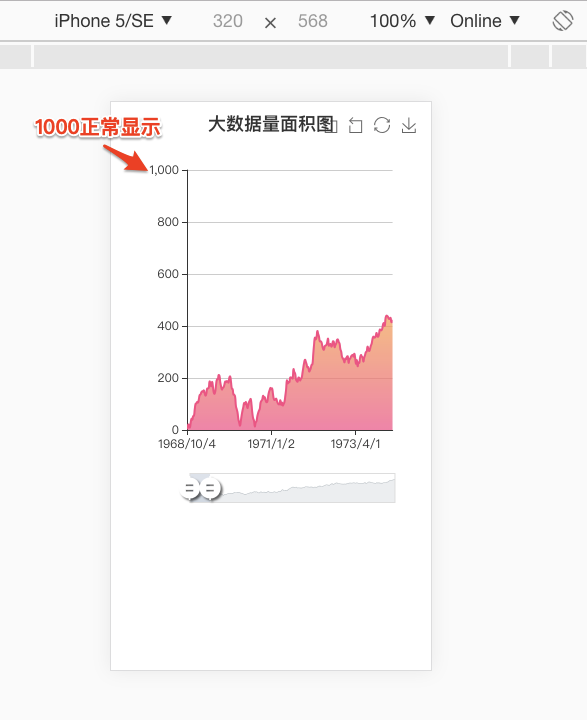
如何防止坐标轴越界
上方图表如果展示到移动版, 坐标轴可能部分无法显示
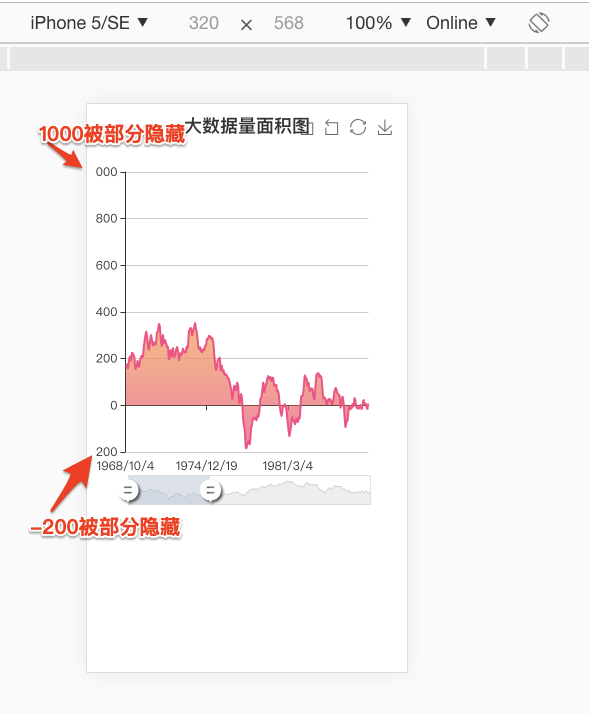
解决方法很简单,只需在option中加一个配置项即可
|
1
2
3
|
grid:{ containLabel: true }, |
源码:
|
1
2
3
4
5
6
7
8
9
10
11
12
13
14
15
16
17
18
19
20
21
22
23
24
25
26
27
28
29
30
31
32
33
34
35
36
37
38
39
40
41
42
43
44
45
46
47
48
49
50
51
52
53
54
55
56
57
58
59
60
61
62
63
64
65
66
67
68
69
70
71
72
73
74
75
76
77
78
79
80
81
82
83
84
85
86
87
88
89
90
91
92
93
94
95
96
97
98
99
100
101
102
103
104
105
|
<!doctype html><html lang="en"><head> <meta charset="UTF-8"> <meta name="viewport" content="width=device-width, user-scalable=no, initial-scale=1.0, maximum-scale=1.0, minimum-scale=1.0"> <meta http-equiv="X-UA-Compatible" content="ie=edge"> <title>Echarts-Demo</title> <script src="./echarts.min.js"></script></head><body> <div id="main" style="100%;height:400px;"></div> <script> // 创建数据 var base = +new Date(1968, 9, 3); var oneDay = 24 * 3600 * 1000; var date = []; var data = [Math.random() * 300]; for (var i = 1; i < 20000; i++) { var now = new Date(base += oneDay); date.push([now.getFullYear(), now.getMonth() + 1, now.getDate()].join('/')); data.push(Math.round((Math.random() - 0.5) * 20 + data[i - 1])); } // 创建对象option option = { tooltip: { trigger: 'axis', position: function (pt) { return [pt[0], '10%']; } }, title: { left: 'center', text: '大数据量面积图', }, toolbox: { feature: { dataZoom: { yAxisIndex: 'none' }, restore: {}, saveAsImage: {} } }, xAxis: { type: 'category', boundaryGap: false, data: date }, yAxis: { type: 'value', boundaryGap: [0, '100%'] }, dataZoom: [{ type: 'inside', start: 0, end: 10 }, { start: 0, end: 10, handleIcon: 'M10.7,11.9v-1.3H9.3v1.3c-4.9,0.3-8.8,4.4-8.8,9.4c0,5,3.9,9.1,8.8,9.4v1.3h1.3v-1.3c4.9-0.3,8.8-4.4,8.8-9.4C19.5,16.3,15.6,12.2,10.7,11.9z M13.3,24.4H6.7V23h6.6V24.4z M13.3,19.6H6.7v-1.4h6.6V19.6z', handleSize: '80%', handleStyle: { color: '#fff', shadowBlur: 3, shadowColor: 'rgba(0, 0, 0, 0.6)', shadowOffsetX: 2, shadowOffsetY: 2 } }], series: [ { name:'模拟数据', type:'line', smooth:true, symbol: 'none', sampling: 'average', itemStyle: { color: 'rgb(255, 70, 131)' }, areaStyle: { color: new echarts.graphic.LinearGradient(0, 0, 0, 1, [{ offset: 0, color: 'rgb(255, 158, 68)' }, { offset: 1, color: 'rgb(255, 70, 131)' }]) }, data: data } ], grid:{ containLabel: true } }; // 将option数据挂载到main节点 echarts.init(document.getElementById('main')).setOption(option); </script></body></html> |
