由于最近工作不是很忙,隧由把之前的charts项目用d3.js重写的一下,其实d3.js文档很多,但是入门不是很难,可是想真的能做一个完成的,交互良好的图还是要下一番功夫的。今天在echarts找到了一个柱状图,如图。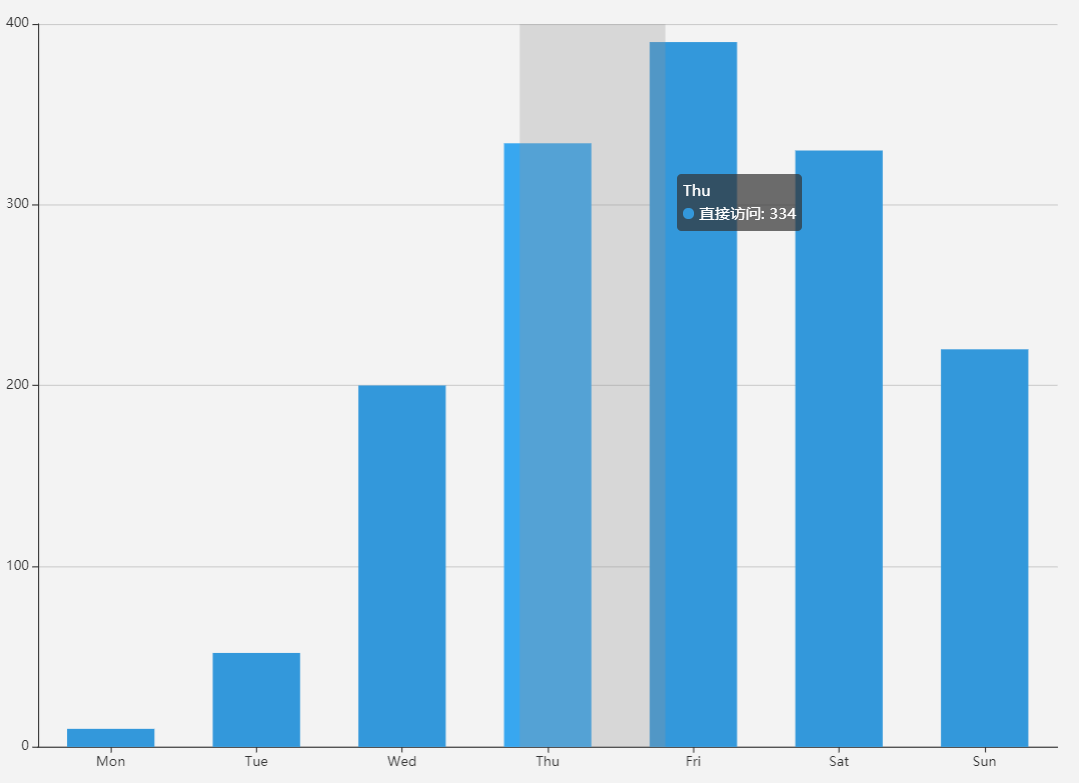
模仿了一番,废话不多说。下面就开始我们的代码(注意是D3.v4版本)。
1. js 类
class Bar {
    constructor() {
        this._width = 1000;
        this._height = 700;
        this._padding = 10;
        this._offset = 35;
        this._margins = {right: 40,bottom: 40,left: 40,top: 40};
        this._scaleX = d3.scaleBand().rangeRound([0, this._width - this._margins.left - this._margins.right]);
        this._scaleY = d3.scaleLinear().range([this._height - this._margins.top - this._margins.bottom, 0]);
        this._color = '#3398DB';
        this._data = [];
        this._svg = null;
        this._body = null;
        this._tooltip = null;
        this._shadow = null;
        this._ticks = 5;
        this._key = 'key';
        this._value = 'value';
    }
    render() {
        if(!this._tooltip) {
            this._tooltip = d3.select('body')
            .append('div')
            .style('left', '40px')
            .style('top', '30px')
            .attr('class', 'tooltip')
            .html('');
        }
        if(!this._svg) {
            this._svg = d3.select('body')
                .append('svg')
                .attr('width', this._width)
                .attr('height', this._height)
            this.renderAxes();
            this.renderClipPath();
        }
        this.renderBody();
    }
    renderAxes() {
        let axes = this._svg.append('g')
            .attr('class', 'axes');

        this.renderXAxis(axes);
        this.renderYAxis(axes);
    }
    renderXAxis(axes) {
        let xAxis = d3.axisBottom().scale(this._scaleX)
        axes.append('g')
            .attr('class', 'x axis')
            .attr('transform', `translate(${this.xStart()}, ${this.yStart()})`)
            .call(xAxis)
    }
    renderYAxis(axes) {
        let yAxis = d3.axisLeft().scale(this._scaleY).ticks(this._ticks);
        axes.append('g')
            .attr('class', 'y axis')
            .attr('transform', `translate(${this.xStart()}, ${this.yEnd()})`)
            .call(yAxis)

        d3.selectAll('.y .tick')
            .append('line')
            .attr('class', 'grid-line')
            .attr('x1', 0)
            .attr('y1', 0)
            .attr('x2', this.quadrantWidth())
            .attr('y2', 0)
    }
    renderClipPath() {
        this._svg.append('defs')
            .append('clip-path')
            .attr('id', 'body-clip')
            .append('rect')
            .attr('x', 0)
            .attr('y', 0)
            .attr('width', this.quadrantWidth())
            .attr('height', this.quadrantHeight())
    }
    renderBody() {
        if(!this._body) {
            this._body = this._svg.append('g')
                .attr('class', 'body')
                .attr('transform', `translate(${this._margins.left},${this._margins.top})`)
                .attr('clip-path', 'url(#clipPath)')
            this.renderShadow()
        }
        this.renderBar();
        this.listenMousemove();
    }
    renderShadow() {
        this._shadow = this._body.append('rect')
            .attr('x', 0)
            .attr('y', 0)
            .attr('width', this.everyWidth())
            .attr('height', this._scaleY(0))
            .attr('fill', '#000')
            .attr('fill-opacity', 0)
    }
    renderBar() {
        let barElements = this._body
            .selectAll('rect.bar')
            .data(this._data);

        let barEnter =  barElements
            .enter()
            .append('rect')
            .attr('class', 'bar')
            .attr('x', d => this._scaleX(d[this._key]) + this.everyWidth() * 0.18)
            .attr('y', () => this._scaleY(0))
            .attr('width', this.everyWidth() * 0.64)
            .attr('height', () => this.quadrantHeight() - this._scaleY(0))

        let barUpdate = barEnter
            .merge(barElements)
            .transition()
            .duration(800)
            .ease(d3.easeCubicOut)
            .attr('y', d => this._scaleY(d[this._value]))
            .attr('height', d => {
                console.log(this.quadrantHeight() - this._scaleY(d[this._value]))
                return this.quadrantHeight() - this._scaleY(d[this._value])
            });

        let barExit = barElements
            .exit()
            .transition()
            .attr('y', () => this._scaleY(0))
            .attr('height', () => this.quadrantHeight() - this._scaleY(0))
            .remove();
    }
    listenMousemove() {
        this._svg.on('mousemove', () => {
            let px = d3.event.offsetX;
            let py = d3.event.offsetY;
            if(px < this.xEnd() && px > this.xStart() && py < this.yStart() && py > this.yEnd()) {
                this.renderShadowAndTooltip(px, py, px - this.xStart());
            } else {
                this.hideShadowAndTooltip();
            }
        })
    }
    renderShadowAndTooltip(x, y, bodyX) {
        let cutIndex = Math.floor(bodyX / this.everyWidth());
        this._shadow.transition().duration(50).ease(d3.easeLinear).attr('fill-opacity', .12).attr('x', cutIndex * this.everyWidth());
        if(x > this.quadrantWidth() - this._tooltip.style('width').slice(0,-2) - this._padding * 2) {
            x = x - this._tooltip.style('width').slice(0,-2) - this._padding * 2 - this._offset * 2;
        }
        if(y > this.quadrantHeight() - this._tooltip.style('height').slice(0,-2) - this._padding * 2) {
            y = y - this._tooltip.style('height').slice(0,-2) - this._padding * 2 - this._offset * 2;
        }
        this._tooltip.html(`${this._data[cutIndex][this._key]}<br/>数量统计: ${this._data[cutIndex][this._value]}`).transition().duration(100).ease(d3.easeLinear).style('display', 'inline-block').style('opacity', .6).style('left', `${x + this._offset + this._padding}px`).style('top', `${y + this._offset + this._padding}px`);
    }
    hideShadowAndTooltip() {
    this._shadow.transition().duration(10).attr('fill-opacity', 0);
    this._tooltip.transition().duration(50).style('opacity', 0).on('end', function() {d3.select(this).style('display', 'none')})
  }
    everyWidth() {
        return this.quadrantWidth() / this._data.length;
    }
    quadrantWidth() {
        return this._width - this._margins.left - this._margins.right;
    }
    quadrantHeight() {
        return this._height - this._margins.top - this._margins.bottom;
    }
    xStart() {
        return this._margins.left;
    }
    xEnd() {
        return this._width - this._margins.right;
    }
    yStart() {
        return this._height - this._margins.bottom;
    }
    yEnd() {
        return this._margins.top;
    }
    scaleX(a) {
        this._scaleX = this._scaleX.domain(a);
    }
    scaleY(a) {
        this._scaleY = this._scaleY.domain(a)
    }
    key(k) {
        if(!arguments.length) return this._key;
        this._key = k;
        this.scaleX(this._data.map(d => d[this._key]))
        return this;
    }
    value(v) {
        if(!arguments.length) return this._value;
        this._value = v;
        let arr = this._data.map(d => d[this._value]);
        let ele = Math.pow(10, d3.max(arr).toString().length - 1);
        let max = Math.ceil(d3.max(arr) / ele) * ele;
        this.scaleY([0, max]);
        return this;
    }
    data(data) {
        if(!arguments.length) return this._data;
        this._data = data;
        return this;
    }
}
2 CSS 文件很简单
.domain {
  stroke-width: 2;
  fill: none;
  stroke: #888;
  shape-rendering: crispEdges;
}
.x .tick line {
  opacity: 0  ;
}
.tick text {
  font-size: 14px;
}
.grid-line {
  fill: none;
  stroke: #888;
  opacity: .4;
  shape-rendering: crispEdges;
}
.bar {
  fill: #3398DB;
}
.tooltip{
  font-size: 15px;
  width: auto;
  padding: 10px;
  height: auto;
  position: absolute;
  text-align: center;
  background-color: #000000;
  opacity: .6;
  border-radius:5px;
  color: #ffffff;
  display: none;
}
3 加下来就是html文件
<!DOCTYPE html>
<html lang="en">
<head>
    <meta charset="UTF-8">
    <title>$Title$</title>
    <link rel="stylesheet" type="text/css" href="css/base.css"/>
    <script type="text/javascript" src="js/d3.v4.js"></script>
    <script type="text/javascript" src="js/bar.js"></script>
</head>
<body>
<script>
    var dataset = [{date: 'Mon', label: 15},{date: 'Tue', label: 52},{date: 'Wed', label: 200},{date: 'Thu', label: 235},{date: 'Fri', label: 390},{date: 'Sat', label: 330},{date: 'Sun', label: 221}];
    var bar = new Bar();
    bar
        .data(dataset)
        .key('date')
        .value('label')
        .render();
</script>
</body>
</html>
4 接着是效果图
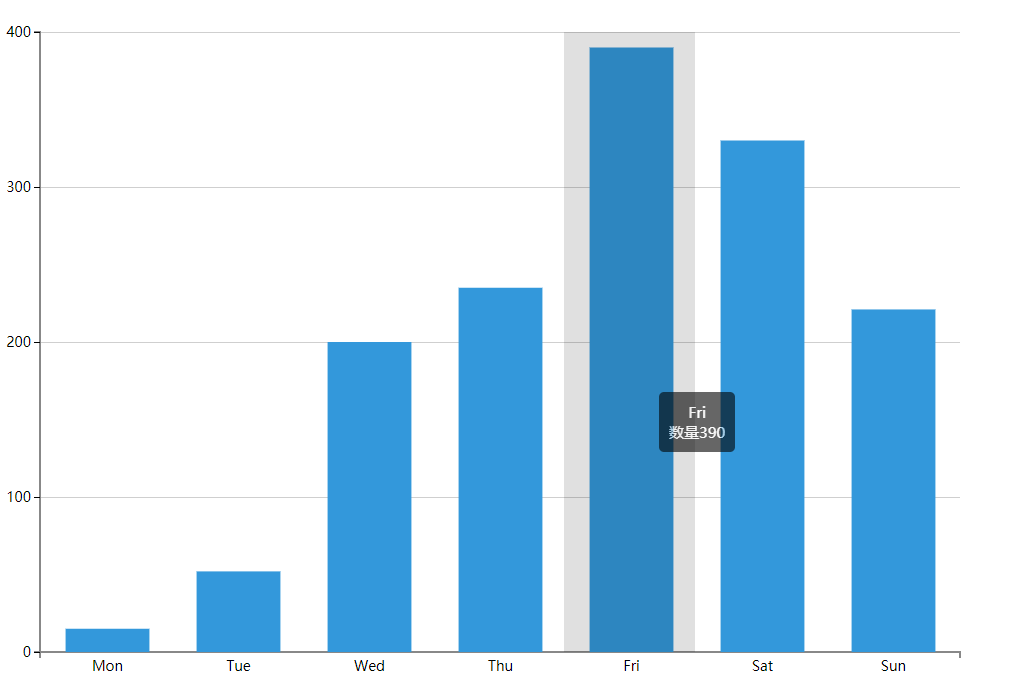
新上手的朋友们可以先学习一下ES6,然后在学习类的思想,d3.v3和v4 v5的版本差异比较大,直接学习d3.v4就可以了,最最后推荐一本书。D3 4.x数据可视化实战手册。这本书比较基础但是能够通过它养成良好的d3编程习惯。祝大家d3学习顺利。
如果想下载代码或者预览这个DEMO请移步到原文!!!