准备两台centos7
ELK 官网:
https://www.elastic.co/cn/what-is/elk-stack
前提:关闭防火墙,关闭selinux
systemctl stop firewalld
setenforce 0
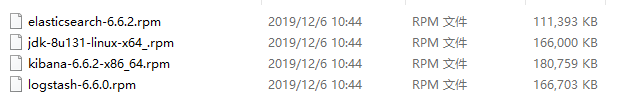
这里我是已经准备好了包和环境 xftp直接上传的
1、准备两台服务器(centos7)
ip:192.168.146.190
ip:192.168.146.191
2、在190和191分别上传后解压安装
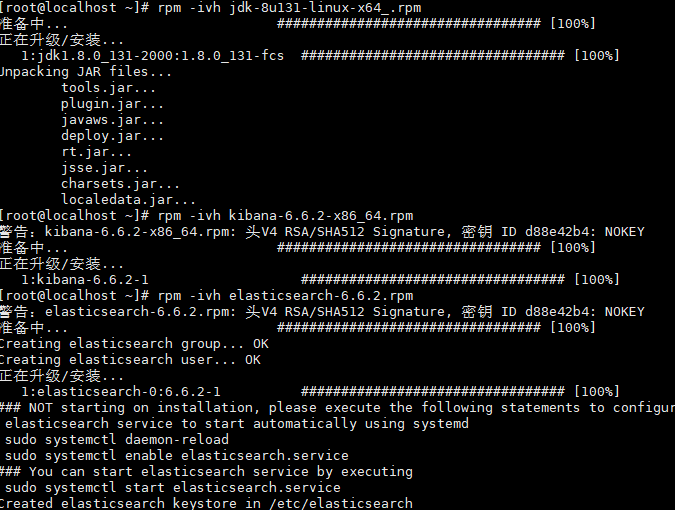
190:

解压安装
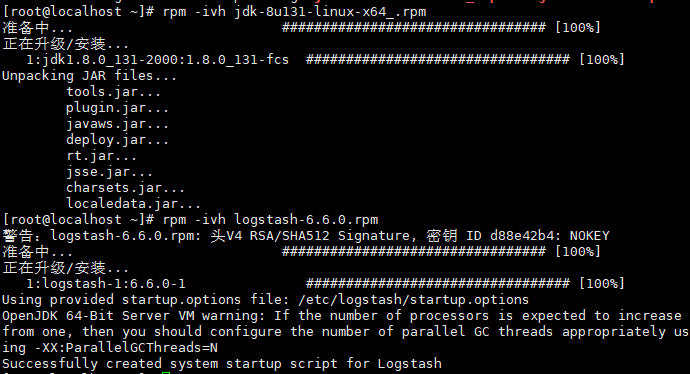
191:
解压安装
3、启动并设置elasticsearch开机自启,修改/etc/elasticsearch/elasticsearch.yml


查看是否修改成功

systemctl start elasticsearch (启动)
查看web接口和内部集群接口是否存在

4、去到191服务器上,启动并设置开机自启

/etc/logstash/logstash.yml 是logstash的主配置文件
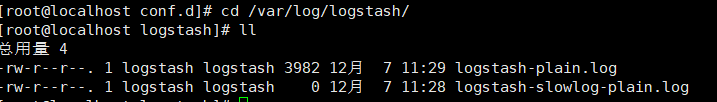
5、重新启动,编辑system.conf,查看是生成日志文件
vim /etc/logstash/conf.d/system.conf
input {
        file {
                path => "/var/log/messages"
                type => "system-log"
                start_position => "beginning"
        }
}
output {
        elasticsearch {
                hosts => "192.168.146.190:9200"
                index => "system_log-%{+YYYY.MM.dd}"
        }
}
此时会生成两个日志
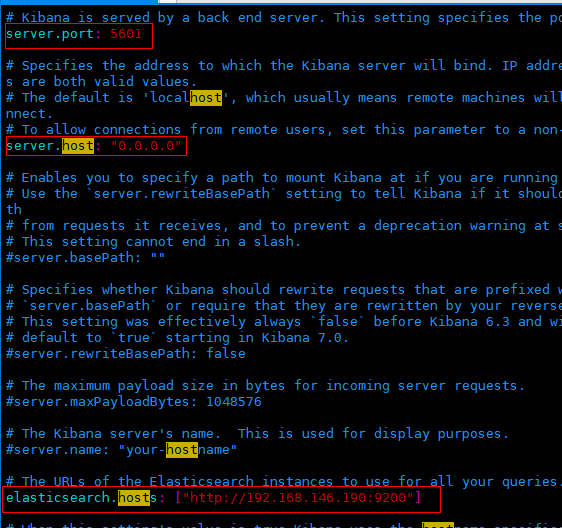
6、修改kibana配置文件
vim /etc/kibana/kibana.yml
测试索引是否正常,两台都输入查看
curl -X GET HTTP://192.168.146.190:9200/_cat/indices?v
如果是这种情况,则可以正常索引
[root@ localhost ~]# curl -X GET HTTP://10.0.0.42:9200/_cat/indices?v
health status index                 uuid                   pri rep docs.count docs.deleted store.size pri.store.size
green  open   .kibana_1             A_jkl66UQ1aZ6ZwpiR16SA   1   0          3            0       19kb           19kb
yellow open   system_log-2020.03.08 vVpll7BvSmOq8eTq_wfw_w   5   1       2143            0      632kb          632kb
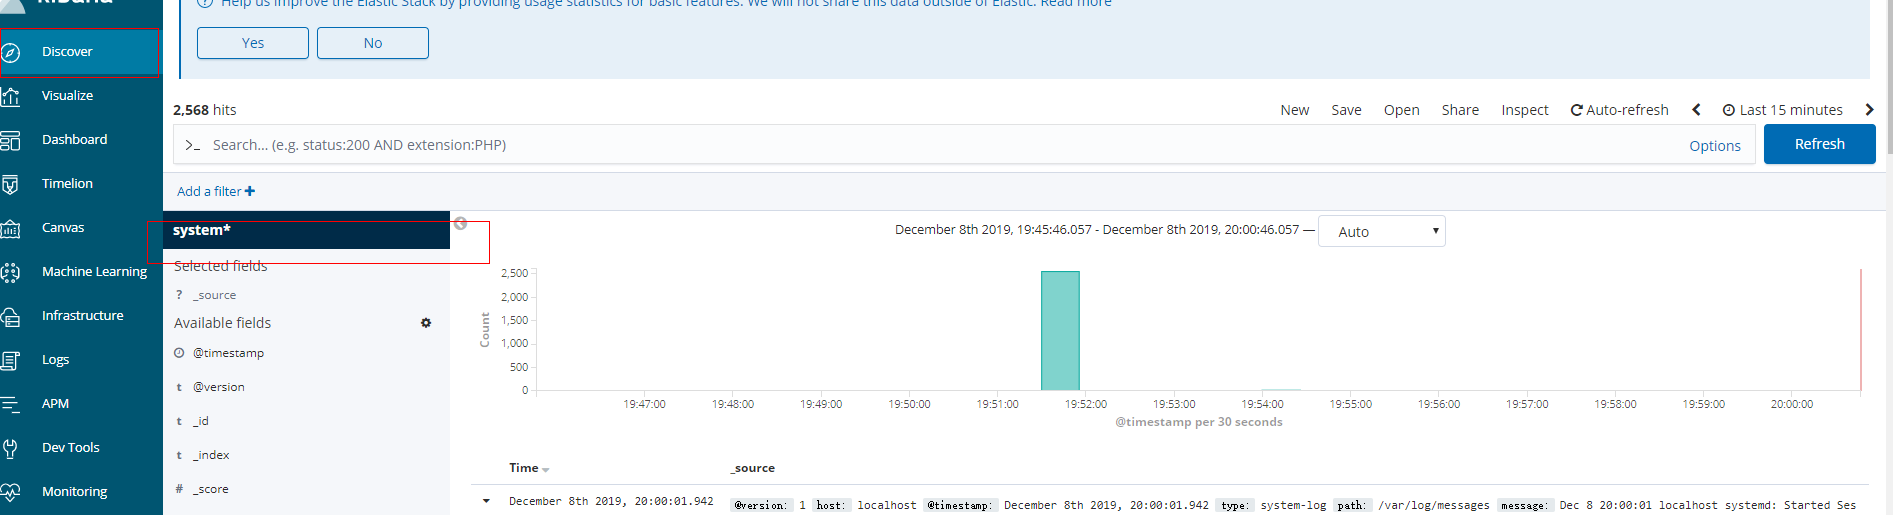
7、给两台的message日志上权限 777 浏览器访问5601
chmod -R 777 /var/log/messages
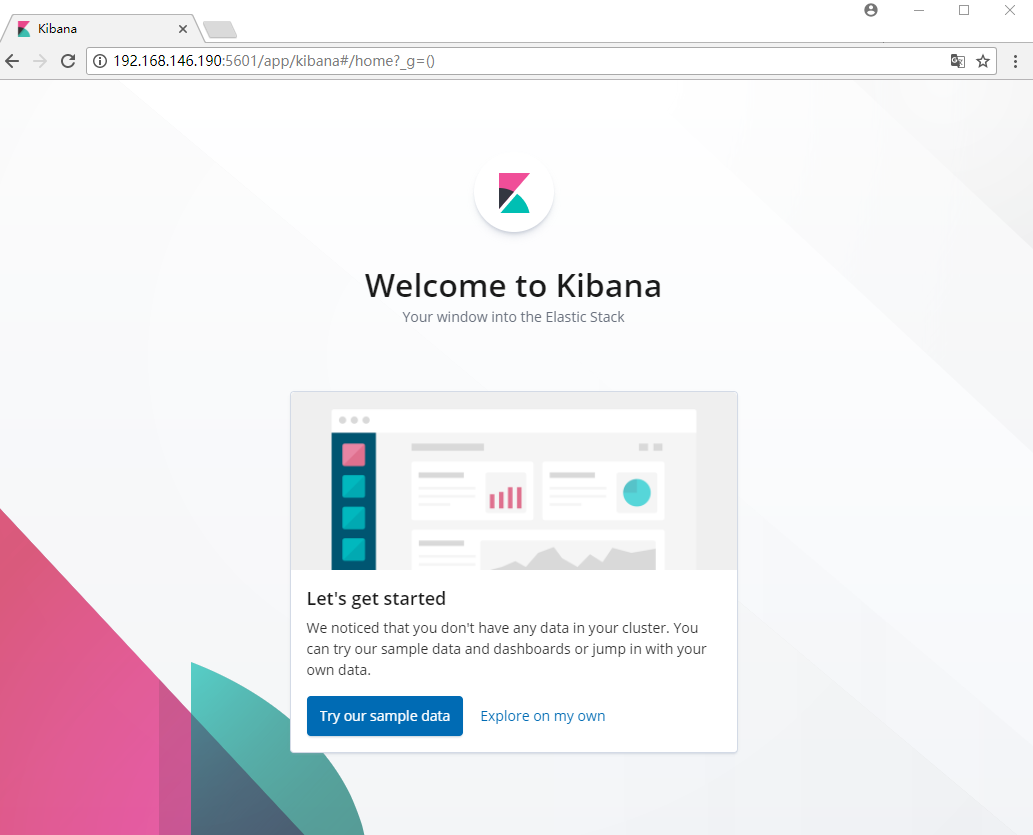
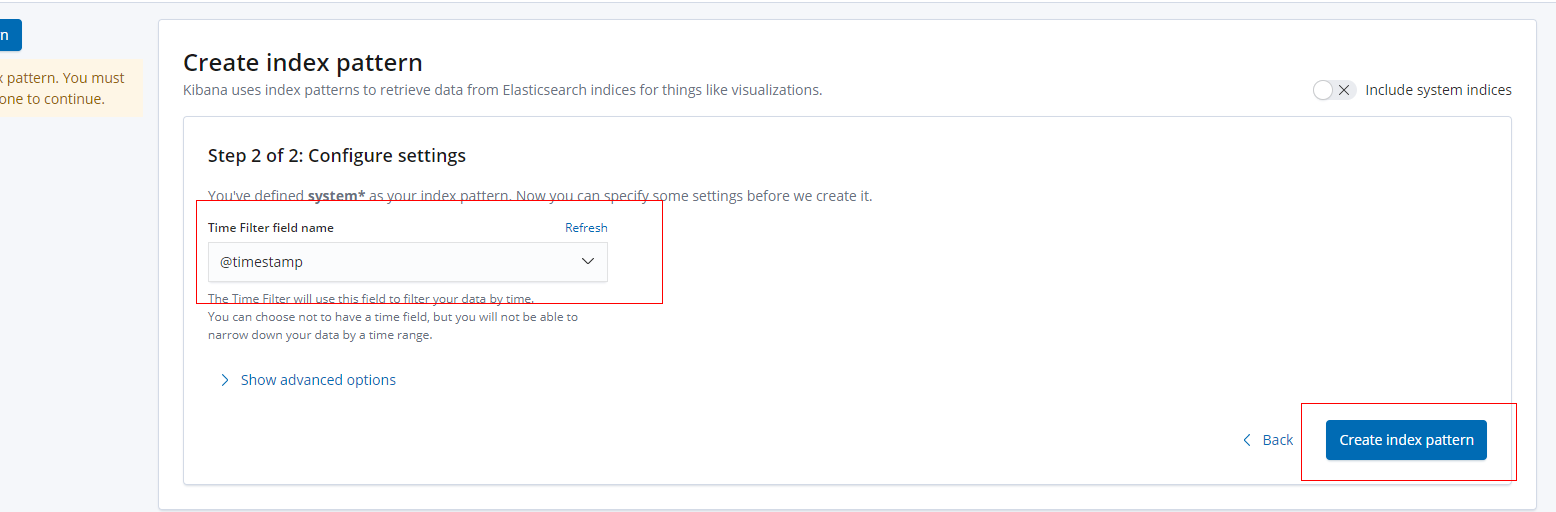
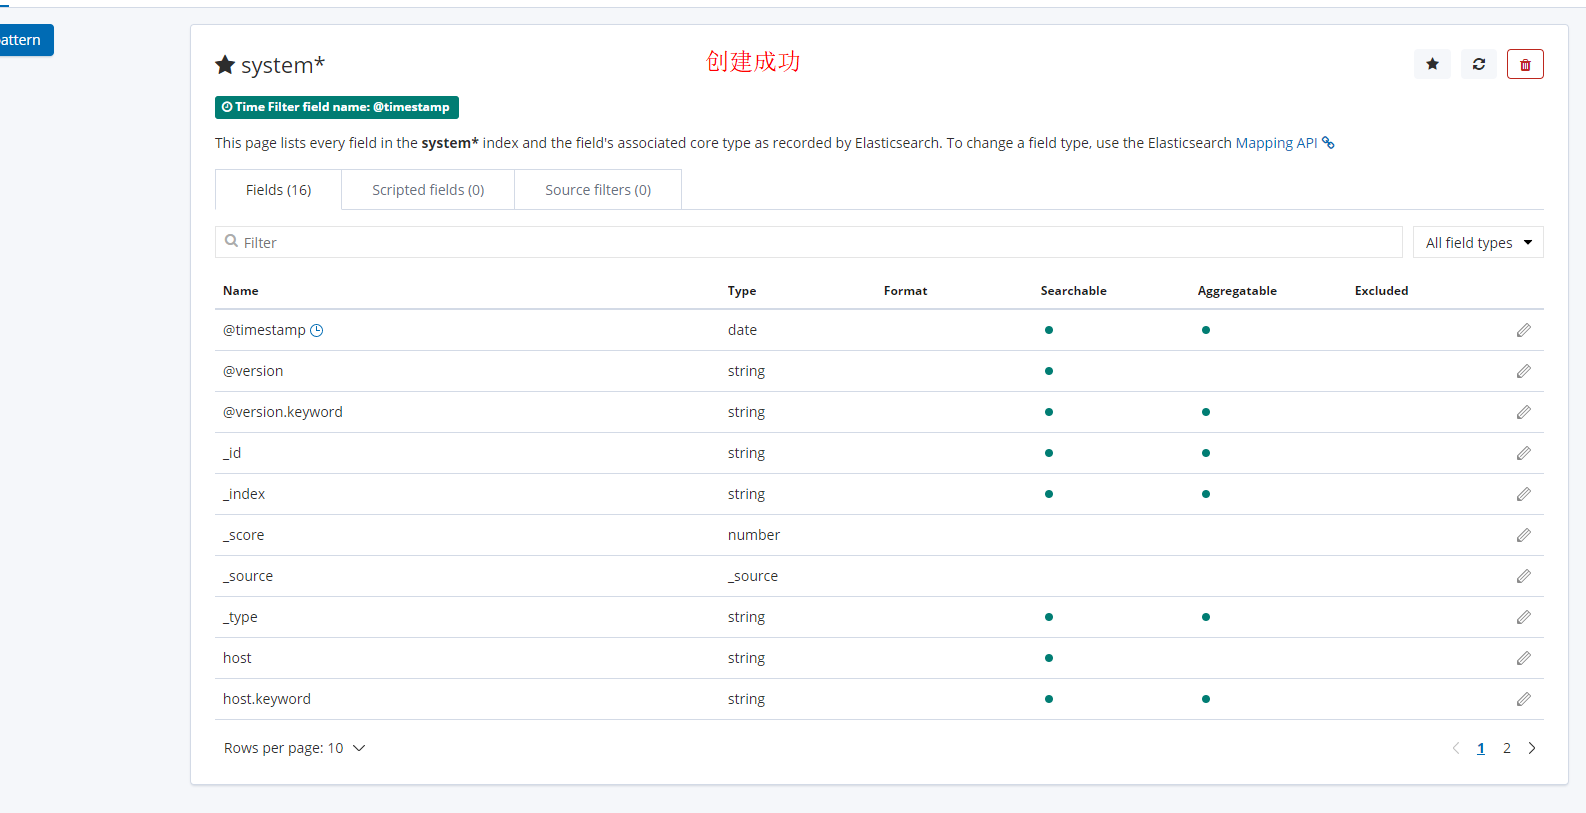
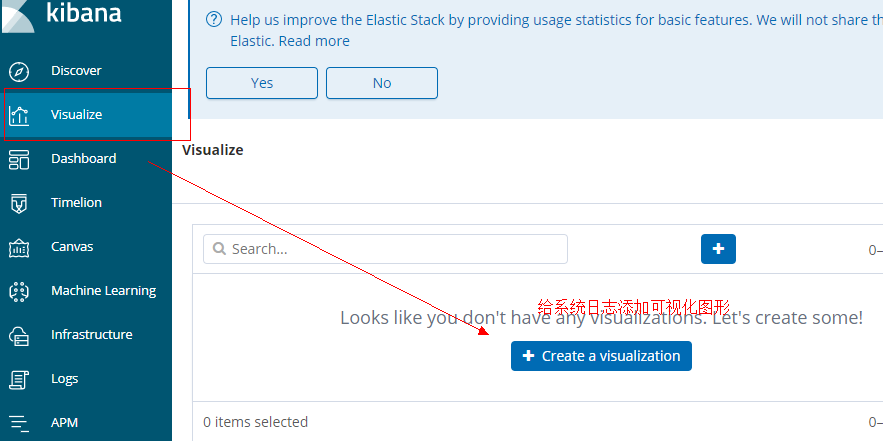
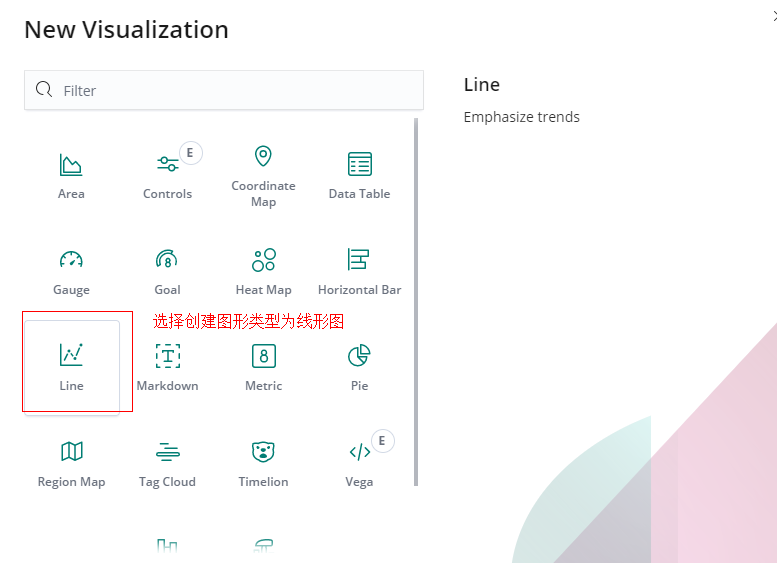
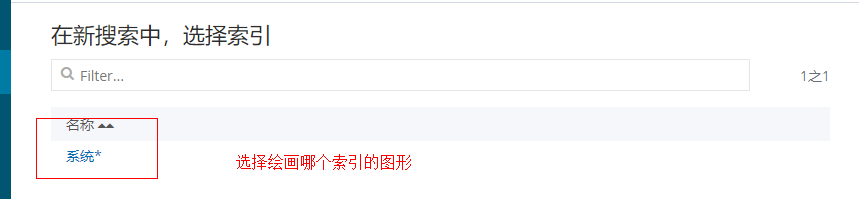
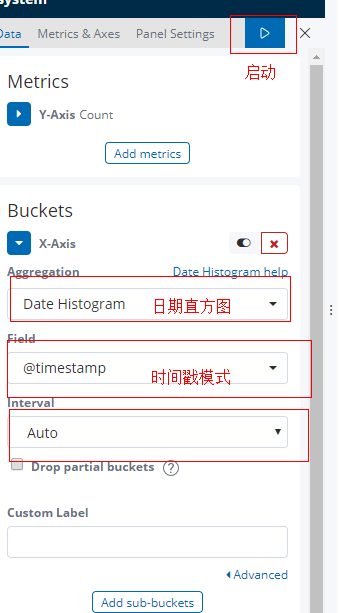
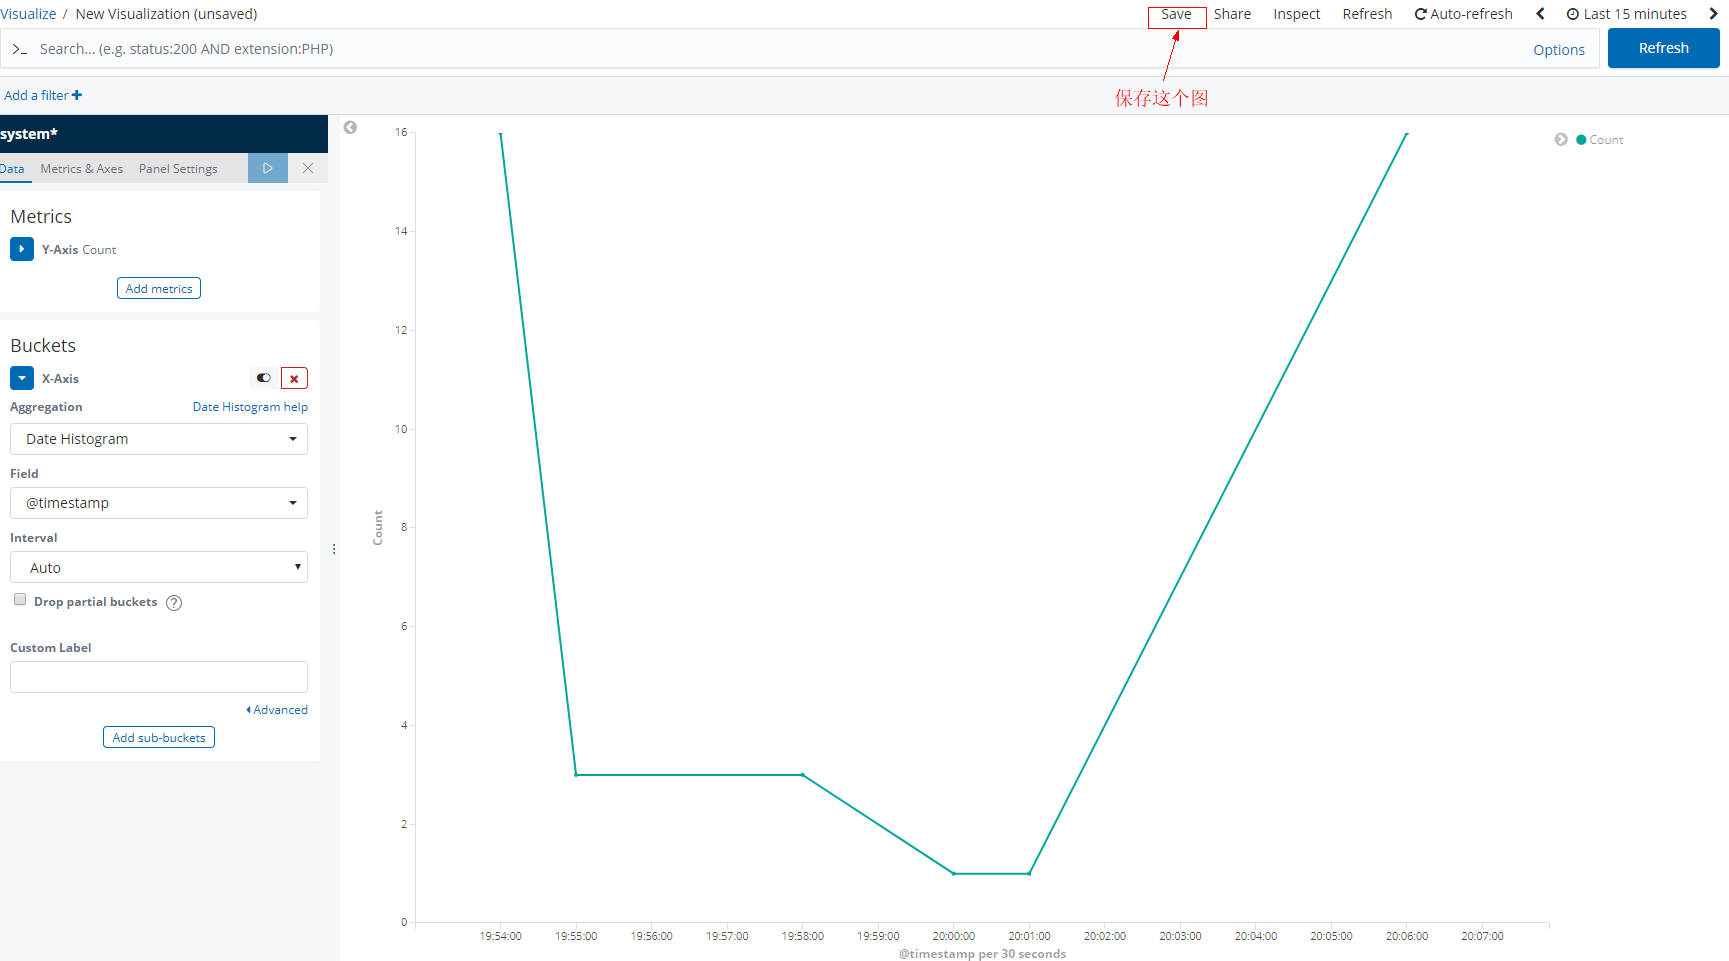
8、 在kibana上创建索引