利用geo3d地图数据画地图上面的柱子
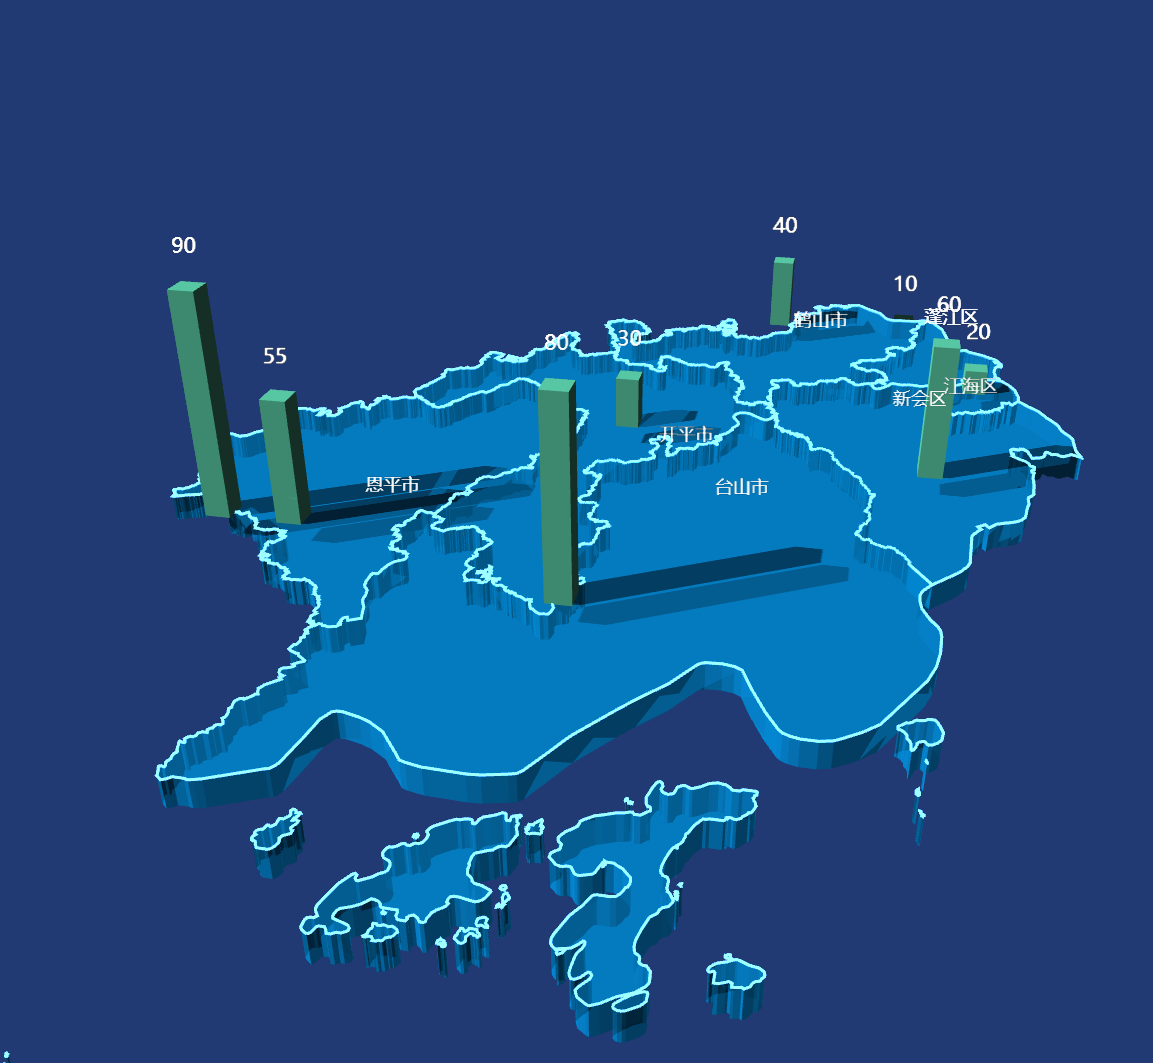
import 'echarts-gl'
import echarts from 'echarts'
import '../../../../map-json/jiangmen'

const data = [{
    name: '蓬江区',
    value: [113.00859, 22.81677, 10],

},
{
    name: '江海区',
    value: [113.119978, 22.567851, 20]
},

{
    name: '新会区',
    value: [113.047065, 22.324486, 60]
},
{
    name: '台山市',
    value: [112.614703, 22.002776, 80]
},
{
    name: '开平市',
    value: [112.597861, 22.390725, 30]
},
{
    name: '鹤山市',
    value: [112.785845, 22.767248, 40]
},
{
    name: '恩平市',
    value: [112.221539, 22.096532, 55]
},
{
    name: '恩平市',
    value: [112.221539, 22.096532, 20]
},
{
    name: '恩平市',
    value: [112.121539, 22.096532, 90]
},

]

class ChartMap extends PureComponent {
    constructor(props) {
        super(props)
        this.state = {
        }
        this.myChart = null
    }

    componentDidMount(){
        this.initEcharts()
    }

    initEcharts = () => {
        this.myChart = echarts.init(this.el, null, {
            renderer: 'canvas',
            height: '800px'
        })
        const option = {
            geo3D: {
                map: '江门',
                show: true,
                zlevel: -10,

                boxWidth: 110,
                boxHeight: 30, // 4:没有bar. 30:有bar,bar最高度30,按比例分配高度
                regionHeight: 3,
                shading: 'lambert',
                label: { // 标签的相关设置
                    show: true, // (地图上的城市名称)是否显示标签 [ default: false ]
                    // distance: 50, // 标签距离图形的距离,在三维的散点图中这个距离是屏幕空间的像素值,其它图中这个距离是相对的三维距离
                    // formatter:, // 标签内容格式器
                    textStyle: { // 标签的字体样式
                        color: '#fff', // 地图初始化区域字体颜色
                        fontSize: 12, // 字体大小
                        opacity: 1, // 字体透明度
                        backgroundColor: 'transparent' // 字体背景色
                    },
                },
                itemStyle: {
                    color: '#0396E8',
                    opacity: 0.5,
                    borderWidth: 2,
                    borderColor: '#67C1FF'
                },
                emphasis: {
                    label: {
                        show: true,
                        textStyle: {
                            color: '#fff',
                            fontSize: 14,
                            backgroundColor: 'transparent' // 字体背景色
                        }
                    },
                    borderColor: '#ADDEFF',
                    borderWidth: 2,
                    itemStyle: {
                        color: '#38D2FF',
                    }
                },
                light: {
                    main: {
                        shadow: true,
                        shadowQuality: 'ultra',
                        intensity: 1,
                        alpha: 40,
                        beta: 300
                    },

                },

                viewControl: {
                    projection: 'perspective',
                    autoRotate: false,
                    // damping: 0,
                    rotateSensitivity: 1, // 旋转操作的灵敏度
                    rotateMouseButton: 'left', // 旋转操作使用的鼠标按键
                    zoomSensitivity: 1, // 缩放操作的灵敏度
                    panSensitivity: 1, // 平移操作的灵敏度
                    // panMouseButton: 'right', // 平移操作使用的鼠标按键

                    distance: 150, // 默认视角距离主体的距离
                    center: [0, 0, 0],

                    // animation: false,
                    // animationDurationUpdate: 1000,
                    // animationEasingUpdate: 'cubicInOut'
                },

            },

            series: [
                // bar
                {
                    type: 'bar3D',
                    coordinateSystem: 'geo3D',
                    zlevel: 3,
                    barSize: 3, // 柱子粗细
                    shading: 'lambert',
                    itemStyle: {
                        color: '#67ebc0'
                    },
                    label: {
                        show: true,
                        position: 'top',
                        textStyle: {
                            color: '#fff',
                            backgroundColor: 'transparent'
                        },
                        formatter(params) {
                            return params.value[2]
                        }
                    },
                    data
                }

            ]
        }

        // 绘制图表
        this.myChart.setOption(option)
    }

    render() {
        return (
            <div className="chart-map" ref={el => { this.el = el }} id="chart-bar-geo" />
        )
    }
}
ChartMap.defaultProps = {
}

ChartMap.propTypes = {
}

export default ChartMap