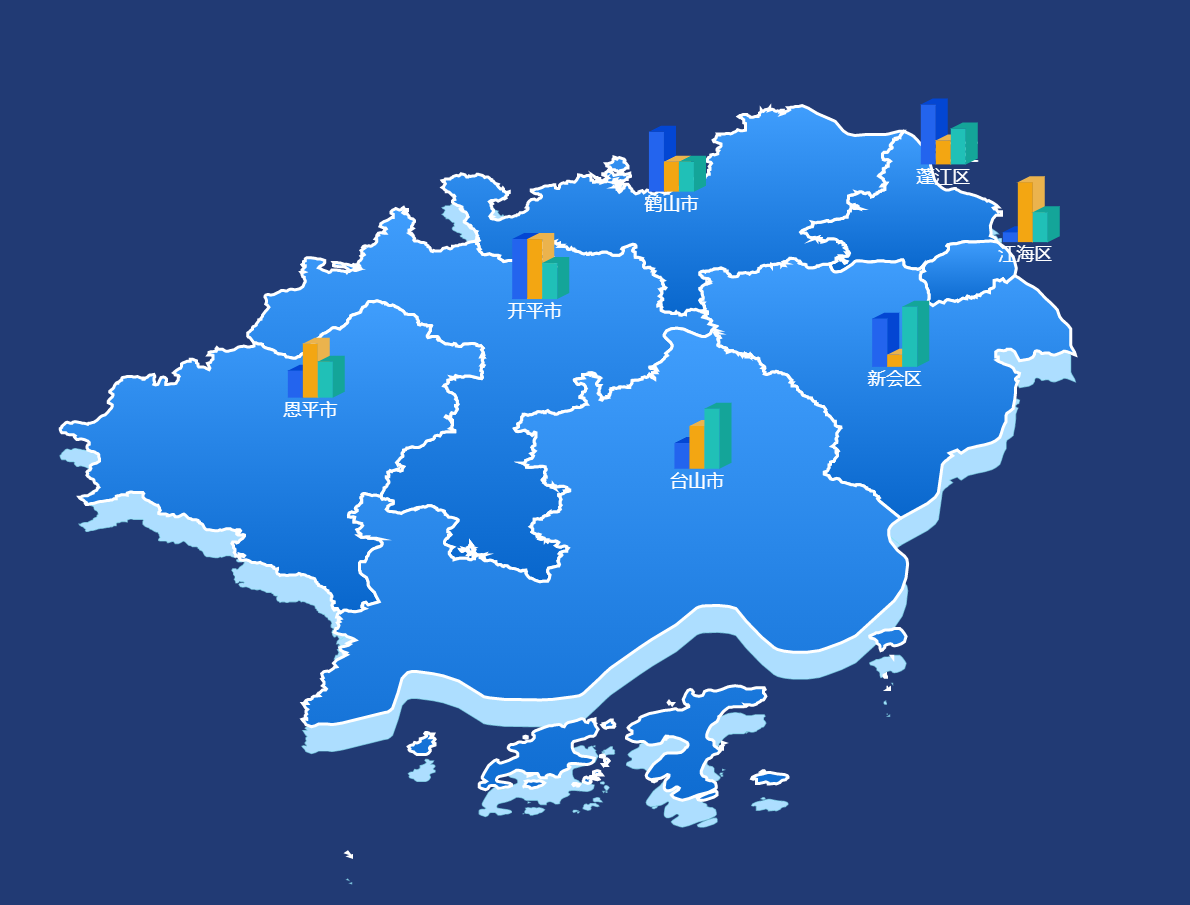
地区地图阴影,加上单点柱状图组的展示
import echarts from 'echarts' import '../../../../map-json/jiangmen' const geoCoordMap = { 市区1: [113.0989, 22.81677], 市区2: [113.200601, 22.672211], 市区3: [113.038584, 22.440247], 市区4: [112.793414, 22.250713], 市区5: [112.592262, 22.566286], 市区6: [112.761795, 22.766104], 市区7: [112.314051, 22.382956], } class ChartMap extends PureComponent { constructor(props) { super(props) this.state = { mapData: [ ['市区1', 50, 20, 30], ['市区2', 10, 60, 30], ['市区3', 40, 10, 50], ['市区4', 30, 50, 70], ['市区5', 50, 50, 30], ['市区6', 60, 30, 30], ['市区7', 45, 90, 60], ], categoryType: ['数据1', '数据2', '数据3'] } this.myChart = null } componentDidMount(){ this.initEcharts() this.renderEachCity() } renderEachCity = () => { const { mapData, categoryType } = this.state const MyCubeRect = echarts.graphic.extendShape({ shape: { x: 0, y: 0, 10, // 柱宽 zWidth: 10, // 阴影折角宽 zHeight: 0, // 阴影折角高 }, buildPath(ctx, shape) { const { api } = shape // 坐标系列 const xAxisPoint = api.coord([shape.xValue, 0]) const p0 = [shape.x, shape.y] const p1 = [shape.x - 5, shape.y] const p4 = [shape.x + 5, shape.y] const p2 = [xAxisPoint[0] - 5, xAxisPoint[1]] const p3 = [xAxisPoint[0] + 5, xAxisPoint[1]] // 描绘的图形 ctx.moveTo(p0[0], p0[1]) // 0 ctx.lineTo(p1[0], p1[1]) // 1 ctx.lineTo(p2[0], p2[1]) // 2 ctx.lineTo(p3[0], p3[1]) // 3 ctx.lineTo(p4[0], p4[1]) // 4 ctx.lineTo(p0[0], p0[1]) // 0 ctx.closePath() } }) const MyCubeShadow = echarts.graphic.extendShape({ shape: { x: 0, y: 0, 15, zWidth: 6, zHeight: 4, }, buildPath(ctx, shape) { const { api } = shape const xAxisPoint = api.coord([shape.xValue, 0]) const p1 = [shape.x - 5, shape.y] const p4 = [shape.x + 5, shape.y] const p6 = [shape.x + 5 + 8, shape.y - 4] const p7 = [shape.x - 5 + 8, shape.y - 4] const p3 = [xAxisPoint[0] + 5, xAxisPoint[1]] const p5 = [xAxisPoint[0] + 5 + 8, xAxisPoint[1] - 4] ctx.moveTo(p4[0], p4[1]) // 4 ctx.lineTo(p3[0], p3[1]) // 3 ctx.lineTo(p5[0], p5[1]) // 5 ctx.lineTo(p6[0], p6[1]) // 6 ctx.lineTo(p4[0], p4[1]) // 4 ctx.moveTo(p4[0], p4[1]) // 4 ctx.lineTo(p6[0], p6[1]) // 6 ctx.lineTo(p7[0], p7[1]) // 7 ctx.lineTo(p1[0], p1[1]) // 1 ctx.lineTo(p4[0], p4[1]) // 4 ctx.closePath() } }) echarts.graphic.registerShape('MyCubeRect', MyCubeRect) echarts.graphic.registerShape('MyCubeShadow', MyCubeShadow) const option = { xAxis: [], yAxis: [], grid: [], series: [ { type: 'map', map: '地市地图', tooltip: { show: false }, label: { show: true, color: '#FFFFFF', fontSize: 16 }, roam: false, aspectScale: 1.5, zoom: 1, // 地图初始大小 center: [112.699885, 22.36442], // 初始中心位置 // layoutCenter: ['50%', '55%'], // 地图位置 // layoutSize: '118%', itemStyle: { normal: { borderColor: 'rgba(147, 235, 248, 0.6)', borderWidth: 0.8, areaColor: '#ADDEFF', }, emphasis: { areaColor: '#ADDEFF' } }, zlevel: -100 } ] } echarts.util.each(mapData, (dataItem, idx) => { const inflationData = [dataItem[1], dataItem[2], dataItem[3]] const geoCoord = geoCoordMap[dataItem[0]]// 获得城市的坐标 const coord = this.myChart.convertToPixel('geo', geoCoord)// 转换坐标系上的点到像素坐标值。 if (!coord && !geoCoord){ return } // const colorList = ['#369BFF', '#EBB34D', '#45BDE0', '#7D95FC', // '#F19350', '#D94EC4', '#F26266', '#0283EA', '#16BA58', '#6E00FF', '#FFCE2F', '#F08C45'] const colorList = ['#2364EE', '#F3A612', '#20C0B7', '#748CF3', '#EE8031', '#C52DAD', '#F26266', '#0283EA', '#16BA58', '#6E00FF', '#FFCE2F', '#F08C45'] const colorListShadow = ['#0346D3', '#EBB34D', '#14A599', '#7D95FC', '#F19350', '#862B77', '#F26266', '#0283EA', '#16BA58', '#6E00FF', '#FFCE2F', '#F08C45'] const index = `${idx}` option.xAxis.push({ id: index, gridId: index, type: 'category', name: dataItem[0], nameTextStyle: { color: '#fff', }, nameLocation: 'middle', nameGap: 3, splitLine: { show: false }, axisTick: { show: false }, axisLabel: { show: false }, axisLine: { show: false }, data: categoryType, z: 200 }) option.yAxis.push({ id: index, gridId: index, splitLine: { show: false }, axisTick: { show: false }, axisLabel: { show: false }, axisLine: { show: false, }, z: 200 }) option.grid.push({ id: index, 30, height: 40, left: coord[0] - 15, top: coord[1] - 15, z: 200 }) option.series.push({ type: 'custom', xAxisId: index, yAxisId: index, data: inflationData, z: 200, renderItem(params, api) { if (!api.value(1)){ return null } const location = api.coord([api.value(0), api.value(1)]) return { type: 'group', children: [ { type: 'MyCubeRect', // shape 属性描述了这个矩形的像素位置和大小 shape: { api, xValue: api.value(0), // 表示取出当前 dataItem 中第一个维度的数值 yValue: api.value(1), x: location[0], y: location[1] }, style: { fill: colorList[params.dataIndex], // 平面颜色 } }, { type: 'MyCubeShadow', shape: { api, xValue: api.value(0), yValue: api.value(1), x: location[0], y: location[1] }, style: { fill: colorListShadow[params.dataIndex], // 平面颜色 } }] } } }) }) this.myChart.resize() this.myChart.setOption(option) } initEcharts = () => { this.myChart = echarts.init(document.getElementById('chart-bar')) const option = { animation: false, // 地图背景颜色 // backgroundColor: transition, tooltip: { trigger: 'axis' }, z: 100, geo: { map: '地市地图', // silent: true, roam: false, aspectScale: 1.5, zoom: 1, // 地图初始大小 center: [112.699885, 22.31442], // 初始中心位置 label: { normal: { show: false, textStyle: { color: '#fff' } }, emphasis: { show: false, textStyle: { color: '#fff' } } }, // 地区块儿颜色 itemStyle: { normal: { areaColor: new echarts.graphic.LinearGradient(0, 0, 0, 1, [{ offset: 0, color: '#409EFD' }, { offset: 1, color: '#0866CC' } ], false), borderColor: '#fff', borderWidth: '2', }, emphasis: { areaColor: new echarts.graphic.LinearGradient(0, 0, 0, 1, [{ offset: 0, color: '#38D2FF' }, { offset: 1, color: '#0396E8' } ], false), } } }, series: [] } // 绘制图表 this.myChart.setOption(option) } render() { return ( <div styleName="chart-map-main" id="chart-bar" /> ) } } ChartMap.defaultProps = { } ChartMap.propTypes = { } export default ChartMap