在循环语句中画出多个subplot图像代码如下
import cv2
import matplotlib.pyplot as plt
import os
import numpy as np
path_image = './picture'
row_sum = []
count = 1
fig1 = plt.figure()
fig2 = plt.figure()
for i in ['packing_list.png', 'packing_list90.png', 'packing_list180.png', 'packing_list270.png']:
# 计算水平投影,即投影到y轴
path_image_current = os.path.join(path_image, i)
image = cv2.imread(path_image_current, 0)
binary = cv2.threshold(image, 0, 255, cv2.THRESH_BINARY | cv2.THRESH_OTSU)[1]
row_sum_per = np.sum(binary, axis=1).tolist()
row_sum.append(row_sum_per)
# 画图
ax1 = fig1.add_subplot(2, 2, count)
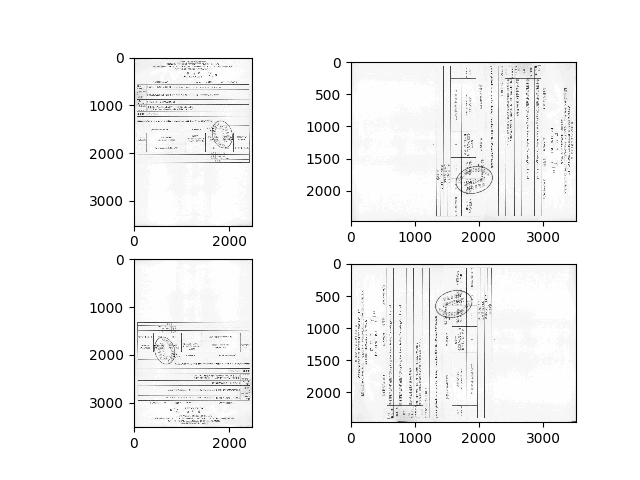
ax1.imshow(image, 'gray')
ax2 = fig2.add_subplot(2, 2, count)
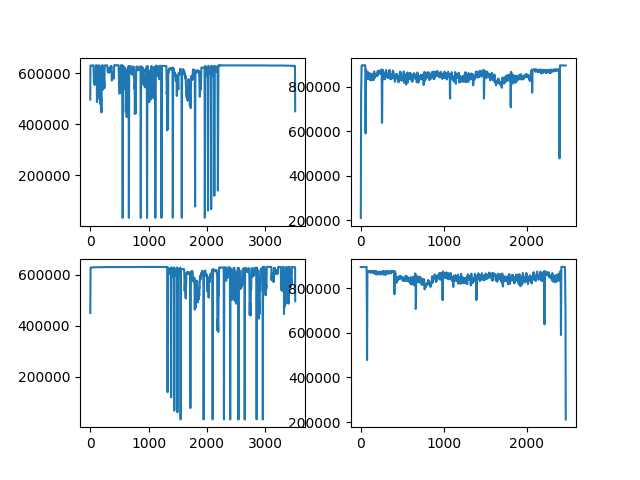
ax2.plot(row_sum_per)
count = count + 1
plt.show()
结果图形: