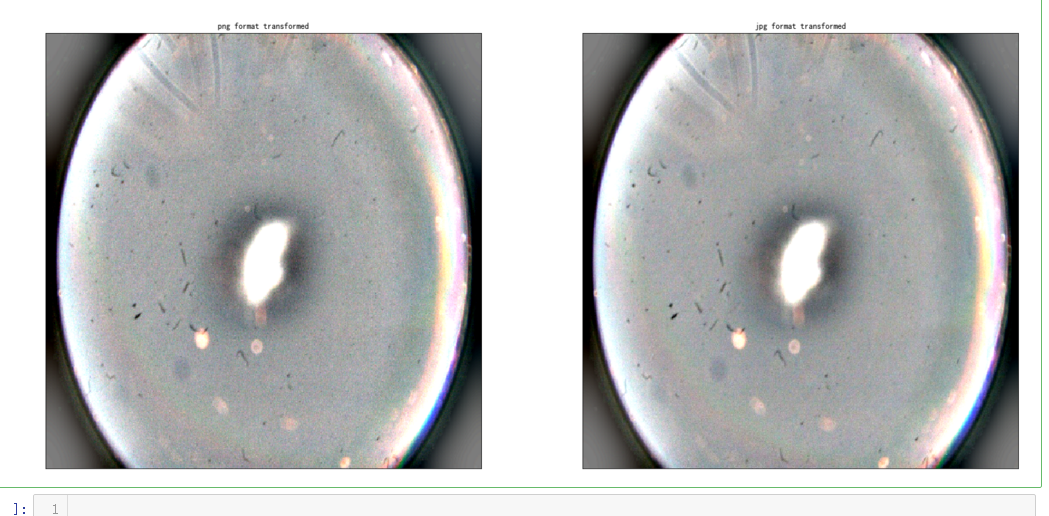
dpi = 80 #inch

path_jpg=f"F:\kaggleDataSet\diabeticRetinopathy\resized_train_cropped\18017_left.jpeg" # too many vessels?
path_png=f"F:\kaggleDataSet\diabeticRetinopathy\rescaled_train_896\18017_left.png" # details are lost
image = cv2.imread(path_png)
image = cv2.cvtColor(image, cv2.COLOR_BGR2RGB)
image = cv2.resize(image, (IMG_SIZE, IMG_SIZE))

image2 =  cv2.imread(path_jpg)
image2 = cv2.cvtColor(image2, cv2.COLOR_BGR2RGB)
image2 = cv2.resize(image2, (IMG_SIZE, IMG_SIZE))

height, width = IMG_SIZE, IMG_SIZE
print(height, width)

SCALE=1/4
figsize = (width / float(dpi))/SCALE, (height / float(dpi))/SCALE

fig = plt.figure(figsize=figsize)
ax = fig.add_subplot(2, 2, 1, xticks=[], yticks=[])
ax.set_title('png format original' )
plt.imshow(image, cmap='gray')
ax = fig.add_subplot(2, 2, 2, xticks=[], yticks=[])
ax.set_title('jpg format original' )
plt.imshow(image2, cmap='gray')

image = load_ben_color(path_png,sigmaX=30)
image2 = load_ben_color(path_jpg,sigmaX=30)
ax = fig.add_subplot(2, 2, 3, xticks=[], yticks=[])
ax.set_title('png format transformed' )
plt.imshow(image, cmap='gray')
ax = fig.add_subplot(2, 2, 4, xticks=[], yticks=[])
ax.set_title('jpg format transformed' )
plt.imshow(image2, cmap='gray')

import json
import math
import os

import cv2
from PIL import Image
import numpy as np
from keras import layers
from keras.applications import DenseNet121
from keras.callbacks import Callback, ModelCheckpoint
from keras.preprocessing.image import ImageDataGenerator
from keras.models import Sequential
from keras.optimizers import Adam
import matplotlib.pyplot as plt
import pandas as pd
from sklearn.model_selection import train_test_split
from sklearn.metrics import cohen_kappa_score, accuracy_score
import scipy
from tqdm import tqdm

%matplotlib inline
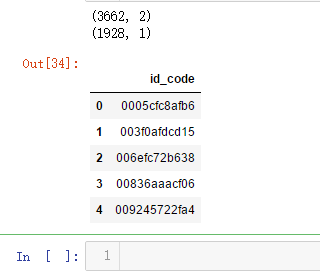
train_df = pd.read_csv('F:\kaggleDataSet\diabeticRetinopathy\trainLabels19.csv')
test_df = pd.read_csv('F:\kaggleDataSet\diabeticRetinopathy\testImages19.csv')
print(train_df.shape)
print(test_df.shape)
test_df.head()
def get_pad_width(im, new_shape, is_rgb=True):
    pad_diff = new_shape - im.shape[0], new_shape - im.shape[1]
    t, b = math.floor(pad_diff[0]/2), math.ceil(pad_diff[0]/2)
    l, r = math.floor(pad_diff[1]/2), math.ceil(pad_diff[1]/2)
    if is_rgb:
        pad_width = ((t,b), (l,r), (0, 0))
    else:
        pad_width = ((t,b), (l,r))
    return pad_width

def preprocess_image(image_path, desired_size=224):
    im = Image.open(image_path)
    im = im.resize((desired_size, )*2, resample=Image.LANCZOS)
    return im
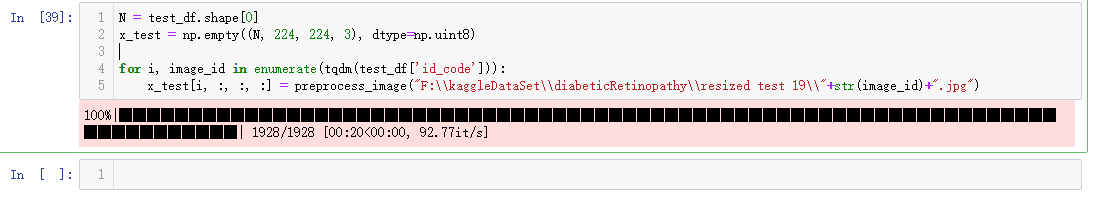
N = test_df.shape[0]
x_test = np.empty((N, 224, 224, 3), dtype=np.uint8)

for i, image_id in enumerate(tqdm(test_df['id_code'])):
    x_test[i, :, :, :] = preprocess_image("F:\kaggleDataSet\diabeticRetinopathy\resized test 19\"+str(image_id)+".jpg")
# model.summary()
def load_image_ben_orig(path,resize=True,crop=False,norm255=True,keras=False):
    image = cv2.imread(path)
    image = cv2.cvtColor(image, cv2.COLOR_BGR2RGB)
    image=cv2.addWeighted( image,4, cv2.GaussianBlur( image , (0,0) ,  10) ,-4 ,128)
    if norm255:
        return image/255
    elif keras:
        #see https://github.com/keras-team/keras-applications/blob/master/keras_applications/imagenet_utils.py for mode
        #see https://github.com/keras-team/keras-applications/blob/master/keras_applications/xception.py for inception,xception mode
        #the use of tf based preprocessing (- and / by 127 respectively) will results in [-1,1] so it will not visualize correctly (directly)
        image = np.expand_dims(image, axis=0)
        return preprocess_input(image)[0]
    else:
        return image.astype(np.int16)
    return image

def transform_image_ben(img,resize=True,crop=False,norm255=True,keras=False):
    image=cv2.addWeighted( img,4, cv2.GaussianBlur( img , (0,0) ,  10) ,-4 ,128)
    if norm255:
        return image/255
    elif keras:
        image = np.expand_dims(image, axis=0)
        return preprocess_input(image)[0]
    else:
        return image.astype(np.int16)
    return image
def display_samples(df, columns=5, rows=2, Ben=True):
    fig=plt.figure(figsize=(5*columns, 4*rows))
    for i in range(columns*rows):
        image_path = df.loc[i,'id_code']
        path = f"F:\kaggleDataSet\diabeticRetinopathy\resized test 19\"+str(image_path)+".jpg"
        if Ben:
            img = load_image_ben_orig(path)
        else:
            img = cv2.imread(path)
            img = cv2.cvtColor(img, cv2.COLOR_BGR2RGB)
        fig.add_subplot(rows, columns, i+1)
        plt.imshow(img)
    plt.tight_layout()
display_samples(test_df, Ben=False)
display_samples(test_df, Ben=True)
