import os
import sys
import random
import math
import re
import time
import numpy as np
import tensorflow as tf
import matplotlib
import matplotlib.pyplot as plt
import matplotlib.patches as patches

import utils
import visualize
from visualize import display_images
import model as modellib
from model import log

%matplotlib inline

# Root directory of the project
ROOT_DIR = os.getcwd()

# Directory to save logs and trained model
MODEL_DIR = os.path.join(ROOT_DIR, "logs")

# Local path to trained weights file
COCO_MODEL_PATH = os.path.join(ROOT_DIR, "mask_rcnn_coco.h5")
# Download COCO trained weights from Releases if needed
if not os.path.exists(COCO_MODEL_PATH):
    utils.download_trained_weights(COCO_MODEL_PATH)

# Path to Shapes trained weights
SHAPES_MODEL_PATH = os.path.join(ROOT_DIR, "mask_rcnn_shapes.h5")
# Run one of the code blocks

# Shapes toy dataset
# import shapes
# config = shapes.ShapesConfig()

# MS COCO Dataset
import coco
config = coco.CocoConfig()
COCO_DIR = "path to COCO dataset"  # TODO: enter value here
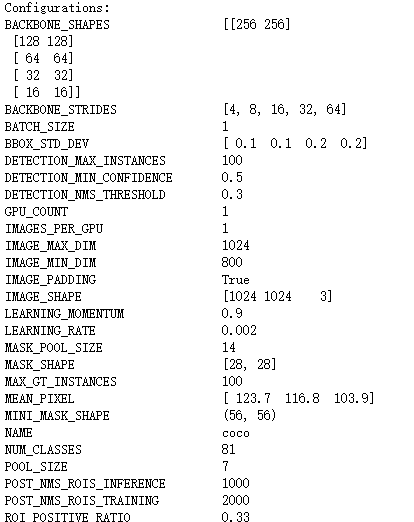
# Override the training configurations with a few
# changes for inferencing.
class InferenceConfig(config.__class__):
    # Run detection on one image at a time
    GPU_COUNT = 1
    IMAGES_PER_GPU = 1

config = InferenceConfig()
config.display()
# Device to load the neural network on.
# Useful if you're training a model on the same
# machine, in which case use CPU and leave the
# GPU for training.
DEVICE = "/cpu:0"  # /cpu:0 or /gpu:0

# Inspect the model in training or inference modes
# values: 'inference' or 'training'
# TODO: code for 'training' test mode not ready yet
TEST_MODE = "inference"
def get_ax(rows=1, cols=1, size=16):
    """Return a Matplotlib Axes array to be used in
    all visualizations in the notebook. Provide a
    central point to control graph sizes.

    Adjust the size attribute to control how big to render images
    """
    _, ax = plt.subplots(rows, cols, figsize=(size*cols, size*rows))
    return ax
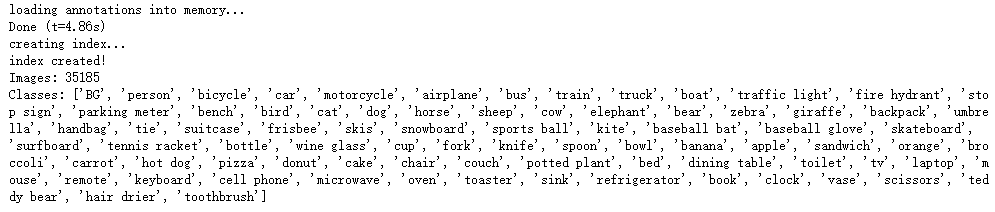
# Build validation dataset
if config.NAME == 'shapes':
    dataset = shapes.ShapesDataset()
    dataset.load_shapes(500, config.IMAGE_SHAPE[0], config.IMAGE_SHAPE[1])
elif config.NAME == "coco":
    dataset = coco.CocoDataset()
    dataset.load_coco(COCO_DIR, "minival")

# Must call before using the dataset
dataset.prepare()

print("Images: {}
Classes: {}".format(len(dataset.image_ids), dataset.class_names))
# Create model in inference mode
with tf.device(DEVICE):
    model = modellib.MaskRCNN(mode="inference", model_dir=MODEL_DIR,
                              config=config)

# Set weights file path
if config.NAME == "shapes":
    weights_path = SHAPES_MODEL_PATH
elif config.NAME == "coco":
    weights_path = COCO_MODEL_PATH
# Or, uncomment to load the last model you trained
# weights_path = model.find_last()[1]

# Load weights
print("Loading weights ", weights_path)
model.load_weights(weights_path, by_name=True)
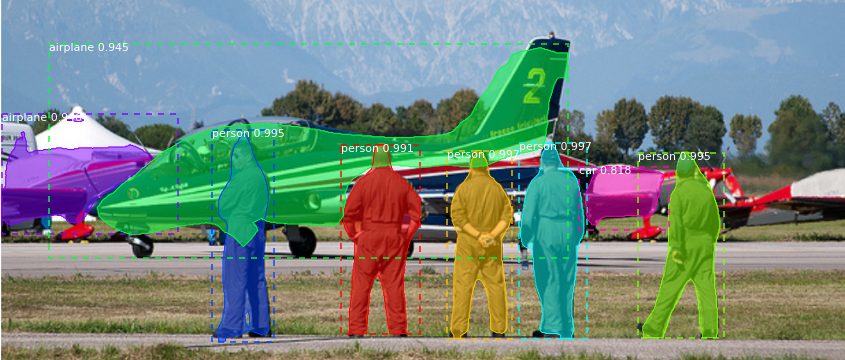
image_id = random.choice(dataset.image_ids)
image, image_meta, gt_class_id, gt_bbox, gt_mask =
    modellib.load_image_gt(dataset, config, image_id, use_mini_mask=False)
info = dataset.image_info[image_id]
print("image ID: {}.{} ({}) {}".format(info["source"], info["id"], image_id,
                                       dataset.image_reference(image_id)))
# Run object detection
results = model.detect([image], verbose=1)

# Display results
ax = get_ax(1)
r = results[0]
visualize.display_instances(image, r['rois'], r['masks'], r['class_ids'],
                            dataset.class_names, r['scores'], ax=ax,
                            title="Predictions")
log("gt_class_id", gt_class_id)
log("gt_bbox", gt_bbox)
log("gt_mask", gt_mask)
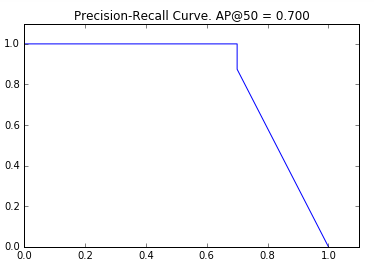
# Draw precision-recall curve
AP, precisions, recalls, overlaps = utils.compute_ap(gt_bbox, gt_class_id, gt_mask,
                                          r['rois'], r['class_ids'], r['scores'], r['masks'])
visualize.plot_precision_recall(AP, precisions, recalls)
# Grid of ground truth objects and their predictions
visualize.plot_overlaps(gt_class_id, r['class_ids'], r['scores'],
                        overlaps, dataset.class_names)

# Compute VOC-style Average Precision
def compute_batch_ap(image_ids):
    APs = []
    for image_id in image_ids:
        # Load image
        image, image_meta, gt_class_id, gt_bbox, gt_mask =
            modellib.load_image_gt(dataset, config,
                                   image_id, use_mini_mask=False)
        # Run object detection
        results = model.detect([image], verbose=0)
        # Compute AP
        r = results[0]
        AP, precisions, recalls, overlaps =
            utils.compute_ap(gt_bbox, gt_class_id, gt_mask,
                              r['rois'], r['class_ids'], r['scores'], r['masks'])
        APs.append(AP)
    return APs

# Pick a set of random images
image_ids = np.random.choice(dataset.image_ids, 10)
APs = compute_batch_ap(image_ids)
print("mAP @ IoU=50: ", np.mean(APs))

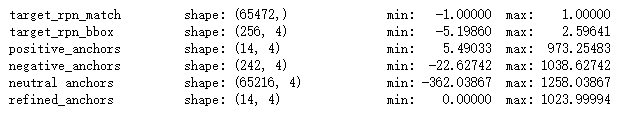
# Generate RPN trainig targets
# target_rpn_match is 1 for positive anchors, -1 for negative anchors
# and 0 for neutral anchors.
target_rpn_match, target_rpn_bbox = modellib.build_rpn_targets(
    image.shape, model.anchors, gt_class_id, gt_bbox, model.config)
log("target_rpn_match", target_rpn_match)
log("target_rpn_bbox", target_rpn_bbox)

positive_anchor_ix = np.where(target_rpn_match[:] == 1)[0]
negative_anchor_ix = np.where(target_rpn_match[:] == -1)[0]
neutral_anchor_ix = np.where(target_rpn_match[:] == 0)[0]
positive_anchors = model.anchors[positive_anchor_ix]
negative_anchors = model.anchors[negative_anchor_ix]
neutral_anchors = model.anchors[neutral_anchor_ix]
log("positive_anchors", positive_anchors)
log("negative_anchors", negative_anchors)
log("neutral anchors", neutral_anchors)

# Apply refinement deltas to positive anchors
refined_anchors = utils.apply_box_deltas(
    positive_anchors,
    target_rpn_bbox[:positive_anchors.shape[0]] * model.config.RPN_BBOX_STD_DEV)
log("refined_anchors", refined_anchors, )
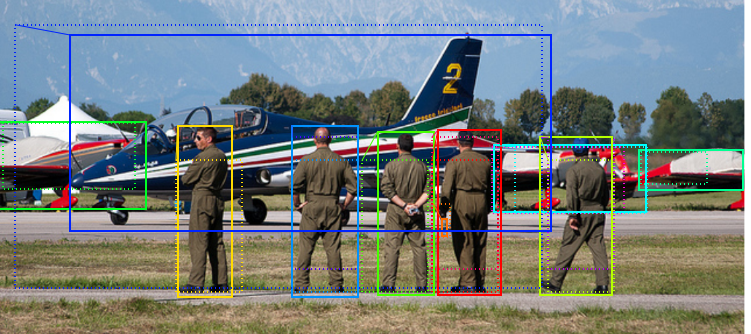
# Display positive anchors before refinement (dotted) and
# after refinement (solid).
visualize.draw_boxes(image, boxes=positive_anchors, refined_boxes=refined_anchors, ax=get_ax())
# Run RPN sub-graph
pillar = model.keras_model.get_layer("ROI").output  # node to start searching from

# TF 1.4 introduces a new version of NMS. Search for both names to support TF 1.3 and 1.4
nms_node = model.ancestor(pillar, "ROI/rpn_non_max_suppression:0")
if nms_node is None:
    nms_node = model.ancestor(pillar, "ROI/rpn_non_max_suppression/NonMaxSuppressionV2:0")

rpn = model.run_graph([image], [
    ("rpn_class", model.keras_model.get_layer("rpn_class").output),
    ("pre_nms_anchors", model.ancestor(pillar, "ROI/pre_nms_anchors:0")),
    ("refined_anchors", model.ancestor(pillar, "ROI/refined_anchors:0")),
    ("refined_anchors_clipped", model.ancestor(pillar, "ROI/refined_anchors_clipped:0")),
    ("post_nms_anchor_ix", nms_node),
    ("proposals", model.keras_model.get_layer("ROI").output),
])

# Show top anchors by score (before refinement)
limit = 100
sorted_anchor_ids = np.argsort(rpn['rpn_class'][:,:,1].flatten())[::-1]
visualize.draw_boxes(image, boxes=model.anchors[sorted_anchor_ids[:limit]], ax=get_ax())

# Show top anchors with refinement. Then with clipping to image boundaries
limit = 50
ax = get_ax(1, 2)
visualize.draw_boxes(image, boxes=rpn["pre_nms_anchors"][0, :limit],
           refined_boxes=rpn["refined_anchors"][0, :limit], ax=ax[0])
visualize.draw_boxes(image, refined_boxes=rpn["refined_anchors_clipped"][0, :limit], ax=ax[1])

# Show refined anchors after non-max suppression
limit = 50
ixs = rpn["post_nms_anchor_ix"][:limit]
visualize.draw_boxes(image, refined_boxes=rpn["refined_anchors_clipped"][0, ixs], ax=get_ax())

# Show final proposals
# These are the same as the previous step (refined anchors
# after NMS) but with coordinates normalized to [0, 1] range.
limit = 50
# Convert back to image coordinates for display
h, w = config.IMAGE_SHAPE[:2]
proposals = rpn['proposals'][0, :limit] * np.array([h, w, h, w])
visualize.draw_boxes(image, refined_boxes=proposals, ax=get_ax())

# Measure the RPN recall (percent of objects covered by anchors)
# Here we measure recall for 3 different methods:
# - All anchors
# - All refined anchors
# - Refined anchors after NMS
iou_threshold = 0.7

recall, positive_anchor_ids = utils.compute_recall(model.anchors, gt_bbox, iou_threshold)
print("All Anchors ({:5})       Recall: {:.3f}  Positive anchors: {}".format(
    model.anchors.shape[0], recall, len(positive_anchor_ids)))

recall, positive_anchor_ids = utils.compute_recall(rpn['refined_anchors'][0], gt_bbox, iou_threshold)
print("Refined Anchors ({:5})   Recall: {:.3f}  Positive anchors: {}".format(
    rpn['refined_anchors'].shape[1], recall, len(positive_anchor_ids)))

recall, positive_anchor_ids = utils.compute_recall(proposals, gt_bbox, iou_threshold)
print("Post NMS Anchors ({:5})  Recall: {:.3f}  Positive anchors: {}".format(
    proposals.shape[0], recall, len(positive_anchor_ids)))

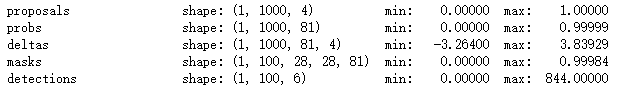
# Get input and output to classifier and mask heads.
mrcnn = model.run_graph([image], [
    ("proposals", model.keras_model.get_layer("ROI").output),
    ("probs", model.keras_model.get_layer("mrcnn_class").output),
    ("deltas", model.keras_model.get_layer("mrcnn_bbox").output),
    ("masks", model.keras_model.get_layer("mrcnn_mask").output),
    ("detections", model.keras_model.get_layer("mrcnn_detection").output),
])
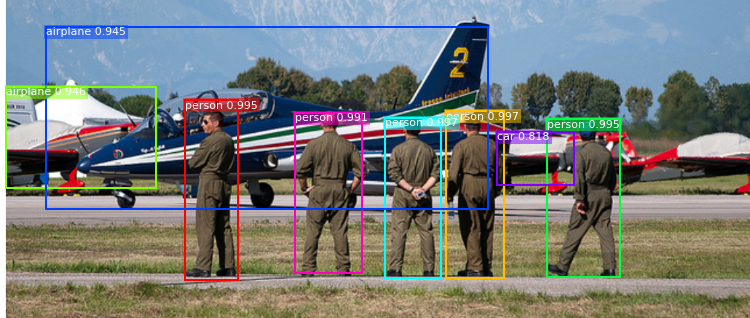
# Get detection class IDs. Trim zero padding.
det_class_ids = mrcnn['detections'][0, :, 4].astype(np.int32)
det_count = np.where(det_class_ids == 0)[0][0]
det_class_ids = det_class_ids[:det_count]
detections = mrcnn['detections'][0, :det_count]

print("{} detections: {}".format(
    det_count, np.array(dataset.class_names)[det_class_ids]))

captions = ["{} {:.3f}".format(dataset.class_names[int(c)], s) if c > 0 else ""
            for c, s in zip(detections[:, 4], detections[:, 5])]
visualize.draw_boxes(
    image,
    refined_boxes=detections[:, :4],
    visibilities=[2] * len(detections),
    captions=captions, title="Detections",
    ax=get_ax())
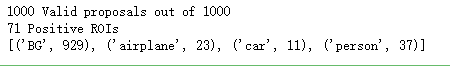
# Proposals are in normalized coordinates. Scale them
# to image coordinates.
h, w = config.IMAGE_SHAPE[:2]
proposals = np.around(mrcnn["proposals"][0] * np.array([h, w, h, w])).astype(np.int32)

# Class ID, score, and mask per proposal
roi_class_ids = np.argmax(mrcnn["probs"][0], axis=1)
roi_scores = mrcnn["probs"][0, np.arange(roi_class_ids.shape[0]), roi_class_ids]
roi_class_names = np.array(dataset.class_names)[roi_class_ids]
roi_positive_ixs = np.where(roi_class_ids > 0)[0]

# How many ROIs vs empty rows?
print("{} Valid proposals out of {}".format(np.sum(np.any(proposals, axis=1)), proposals.shape[0]))
print("{} Positive ROIs".format(len(roi_positive_ixs)))

# Class counts
print(list(zip(*np.unique(roi_class_names, return_counts=True))))
# Display a random sample of proposals.
# Proposals classified as background are dotted, and
# the rest show their class and confidence score.
limit = 200
ixs = np.random.randint(0, proposals.shape[0], limit)
captions = ["{} {:.3f}".format(dataset.class_names[c], s) if c > 0 else ""
            for c, s in zip(roi_class_ids[ixs], roi_scores[ixs])]
visualize.draw_boxes(image, boxes=proposals[ixs],
                     visibilities=np.where(roi_class_ids[ixs] > 0, 2, 1),
                     captions=captions, title="ROIs Before Refinement",
                     ax=get_ax())

# Class-specific bounding box shifts.
roi_bbox_specific = mrcnn["deltas"][0, np.arange(proposals.shape[0]), roi_class_ids]
log("roi_bbox_specific", roi_bbox_specific)

# Apply bounding box transformations
# Shape: [N, (y1, x1, y2, x2)]
refined_proposals = utils.apply_box_deltas(
    proposals, roi_bbox_specific * config.BBOX_STD_DEV).astype(np.int32)
log("refined_proposals", refined_proposals)

# Show positive proposals
# ids = np.arange(roi_boxes.shape[0])  # Display all
limit = 5
ids = np.random.randint(0, len(roi_positive_ixs), limit)  # Display random sample
captions = ["{} {:.3f}".format(dataset.class_names[c], s) if c > 0 else ""
            for c, s in zip(roi_class_ids[roi_positive_ixs][ids], roi_scores[roi_positive_ixs][ids])]
visualize.draw_boxes(image, boxes=proposals[roi_positive_ixs][ids],
                     refined_boxes=refined_proposals[roi_positive_ixs][ids],
                     visibilities=np.where(roi_class_ids[roi_positive_ixs][ids] > 0, 1, 0),
                     captions=captions, title="ROIs After Refinement",
                     ax=get_ax())

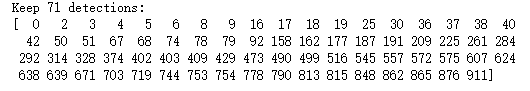
# Remove boxes classified as background
keep = np.where(roi_class_ids > 0)[0]
print("Keep {} detections:
{}".format(keep.shape[0], keep))
# Remove low confidence detections
keep = np.intersect1d(keep, np.where(roi_scores >= config.DETECTION_MIN_CONFIDENCE)[0])
print("Remove boxes below {} confidence. Keep {}:
{}".format(
    config.DETECTION_MIN_CONFIDENCE, keep.shape[0], keep))

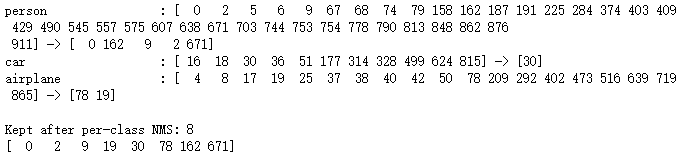
# Apply per-class non-max suppression
pre_nms_boxes = refined_proposals[keep]
pre_nms_scores = roi_scores[keep]
pre_nms_class_ids = roi_class_ids[keep]

nms_keep = []
for class_id in np.unique(pre_nms_class_ids):
    # Pick detections of this class
    ixs = np.where(pre_nms_class_ids == class_id)[0]
    # Apply NMS
    class_keep = utils.non_max_suppression(pre_nms_boxes[ixs],
                                            pre_nms_scores[ixs],
                                            config.DETECTION_NMS_THRESHOLD)
    # Map indicies
    class_keep = keep[ixs[class_keep]]
    nms_keep = np.union1d(nms_keep, class_keep)
    print("{:22}: {} -> {}".format(dataset.class_names[class_id][:20],
                                   keep[ixs], class_keep))

keep = np.intersect1d(keep, nms_keep).astype(np.int32)
print("
Kept after per-class NMS: {}
{}".format(keep.shape[0], keep))
# Show final detections
ixs = np.arange(len(keep))  # Display all
# ixs = np.random.randint(0, len(keep), 10)  # Display random sample
captions = ["{} {:.3f}".format(dataset.class_names[c], s) if c > 0 else ""
            for c, s in zip(roi_class_ids[keep][ixs], roi_scores[keep][ixs])]
visualize.draw_boxes(
    image, boxes=proposals[keep][ixs],
    refined_boxes=refined_proposals[keep][ixs],
    visibilities=np.where(roi_class_ids[keep][ixs] > 0, 1, 0),
    captions=captions, title="Detections after NMS",
    ax=get_ax())

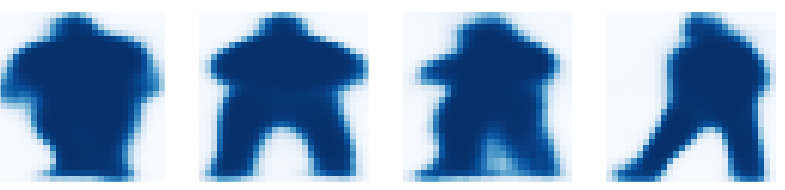
display_images(np.transpose(gt_mask, [2, 0, 1]), cmap="Blues")
# Get predictions of mask head
mrcnn = model.run_graph([image], [
    ("detections", model.keras_model.get_layer("mrcnn_detection").output),
    ("masks", model.keras_model.get_layer("mrcnn_mask").output),
])

# Get detection class IDs. Trim zero padding.
det_class_ids = mrcnn['detections'][0, :, 4].astype(np.int32)
det_count = np.where(det_class_ids == 0)[0][0]
det_class_ids = det_class_ids[:det_count]

print("{} detections: {}".format(
    det_count, np.array(dataset.class_names)[det_class_ids]))

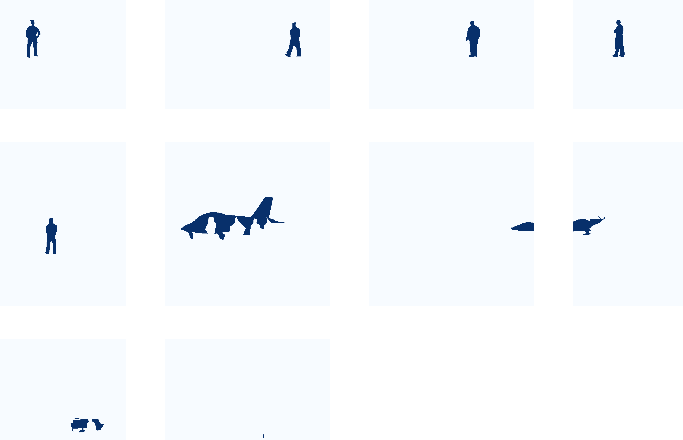
# Masks
det_boxes = mrcnn["detections"][0, :, :4].astype(np.int32)
det_mask_specific = np.array([mrcnn["masks"][0, i, :, :, c]
                              for i, c in enumerate(det_class_ids)])
det_masks = np.array([utils.unmold_mask(m, det_boxes[i], image.shape)
                      for i, m in enumerate(det_mask_specific)])
log("det_mask_specific", det_mask_specific)
log("det_masks", det_masks)

display_images(det_mask_specific[:4] * 255, cmap="Blues", interpolation="none")
display_images(det_masks[:4] * 255, cmap="Blues", interpolation="none")

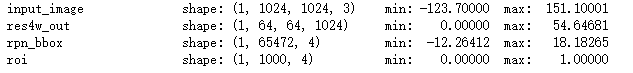
# Get activations of a few sample layers
activations = model.run_graph([image], [
    ("input_image",        model.keras_model.get_layer("input_image").output),
    ("res4w_out",          model.keras_model.get_layer("res4w_out").output),  # for resnet100
    ("rpn_bbox",           model.keras_model.get_layer("rpn_bbox").output),
    ("roi",                model.keras_model.get_layer("ROI").output),
])
# Input image (normalized)
_ = plt.imshow(modellib.unmold_image(activations["input_image"][0],config))

# Backbone feature map
display_images(np.transpose(activations["res4w_out"][0,:,:,:4], [2, 0, 1]))
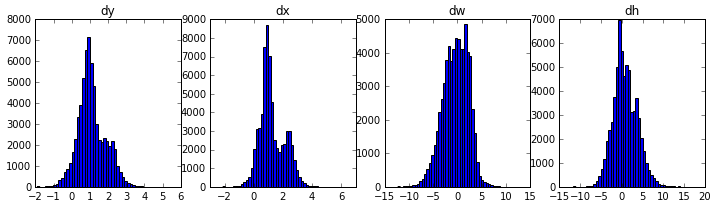
# Histograms of RPN bounding box deltas
plt.figure(figsize=(12, 3))
plt.subplot(1, 4, 1)
plt.title("dy")
_ = plt.hist(activations["rpn_bbox"][0,:,0], 50)
plt.subplot(1, 4, 2)
plt.title("dx")
_ = plt.hist(activations["rpn_bbox"][0,:,1], 50)
plt.subplot(1, 4, 3)
plt.title("dw")
_ = plt.hist(activations["rpn_bbox"][0,:,2], 50)
plt.subplot(1, 4, 4)
plt.title("dh")
_ = plt.hist(activations["rpn_bbox"][0,:,3], 50)
# Distribution of y, x coordinates of generated proposals
plt.figure(figsize=(10, 5))
plt.subplot(1, 2, 1)
plt.title("y1, x1")
plt.scatter(activations["roi"][0,:,0], activations["roi"][0,:,1])
plt.subplot(1, 2, 2)
plt.title("y2, x2")
plt.scatter(activations["roi"][0,:,2], activations["roi"][0,:,3])
plt.show()
