https://www.youtube.com/watch?v=vmEHCJofslg&t=898s
!. Loading data into Pandas
You can use read_csv function and specifiy a delimiter to separate the columns.

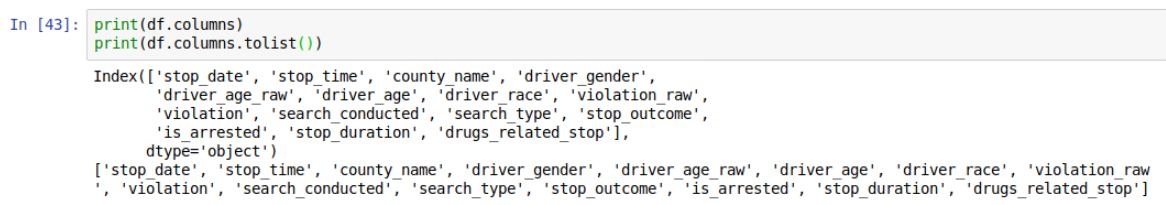
2. Reading Data in Pandas
- pd.columns refers to read headers, while pd.columns.to_list() covert the columns to a list
- Read each column
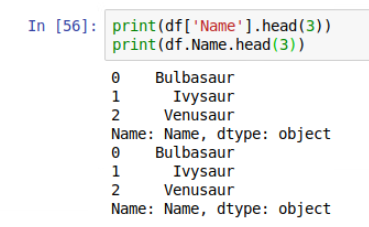
If you want to get multiple columns at the same time, you can change this single word to a list of column names. Note: you have to use double brackets and separate it by commas.

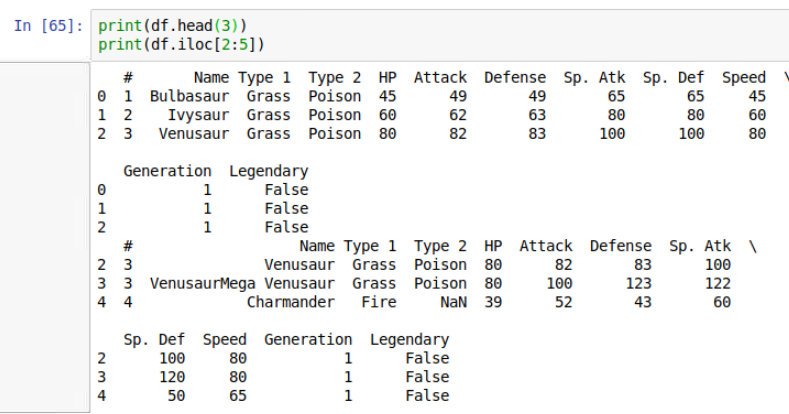
- Read each row
we can print out the first serveral rows or last serveral rows by using pd.head() or pd.tail(). also you can print out certain rows by using pd.iloc().
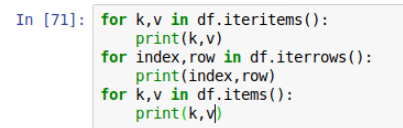
but if you want to iterate thru each row in the dataset, you can ues for loop and pd.iterrows() function. The easiest way to go row by row and access any sort of data you might want.

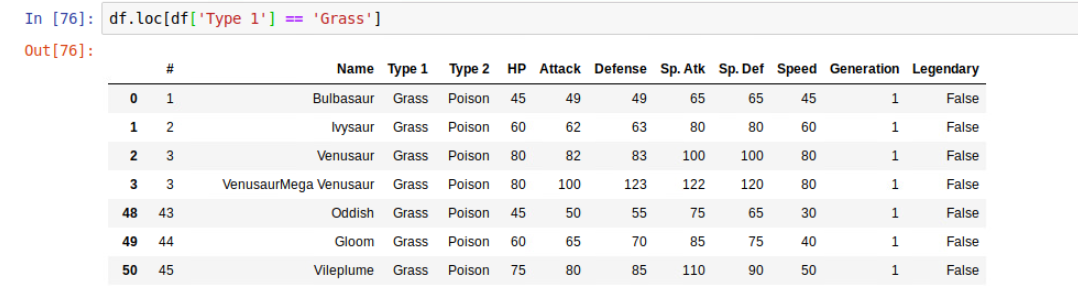
pd.loc() function is used for finding specific data in our data set. and you can use multiple conditions to all sorts of conditional statements.
- Sorting/Describing Data
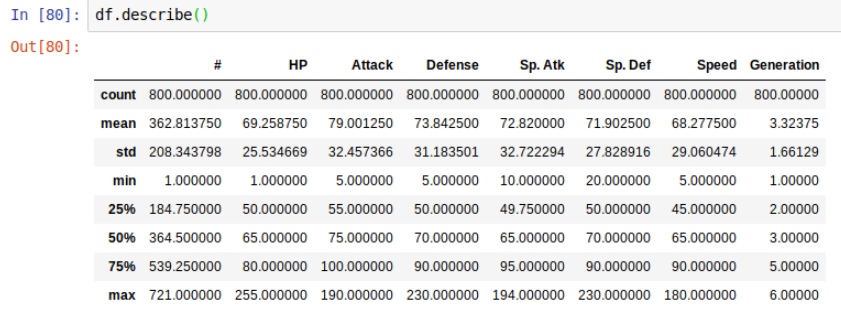
pd.describe() gives us like all the high level mean, standard, deviation type stats.
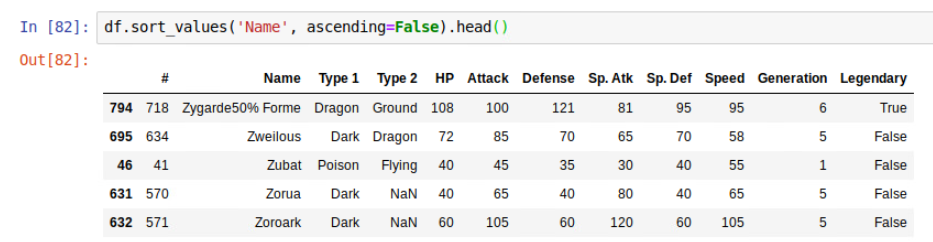
pd.sort_vlaues() can do some sorting of the values instead of going from first downwards. if you want to sort values by name, you have to pass in the column name you want to sort.
- Making changes to the data
add some comlumns

pd.iloc() to add some comlumns: if you want all the rows so the first input is going to be the colon, and then the columns, I want to add together would be HP thru Speed, so that will be the fourth column to the 9th columns. you can use sum function to add horizontally or vertically if you want to specify axis =1 / 0.

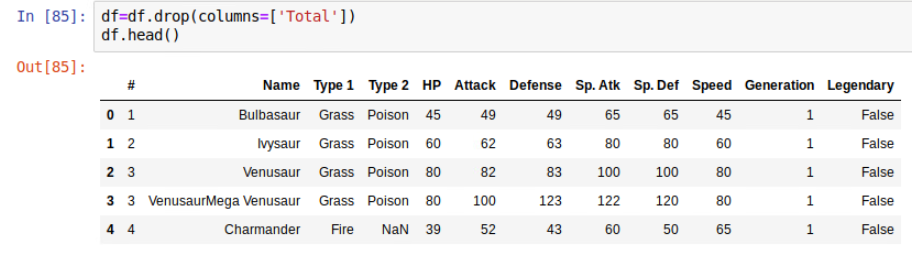
pd.drop() to drop some comlumns. Note: you have pass it back to the dataframe df.
https://www.dataschool.io/best-practices-with-pandas/
https://github.com/justmarkham/pycon-2018-tutorial
1. Introducing the dataset
This video covers the following topics: reading a CSV file, DataFrame shape, data types, NaN, missing values, booleans
2. Removing columns
This video covers the following topics: missing values, dropping a column, axis parameter, inplace parameter, dropna method.
3. Comparing groups (8:42)
This video covers the following topics: filtering a DataFrame, value_counts method, normalization, groupby method.
4. Examining relationships (8:44)
This video covers the following topics: value_counts method, math with booleans, groupby with multiple columns, correlation versus causation.
5. Handling missing values (5:02)
This video covers the following topics: math with booleans, value_counts method, filtering a DataFrame, dropna parameter.
6. Using string methods (5:55)
This video covers the following topics: searching strings, math with booleans, value_counts method, dropna parameter.
7. Combining dates and times (9:11)
This video covers the following topics: string slicing, string concatenation, converting to datetime format, datetime attributes, value_counts method.
8. Plotting a time series (8:48)
This video covers the following topics: math with booleans, groupby method, datetime attributes, line plots.
9. Creating useful plots (8:47)
This video covers the following topics: datetime attributes, value_counts method, line plots, sorting, groupby method.
10. Fixing bad data (16:31)
This video covers the following topics: value_counts method, filtering by multiple conditions, missing values, NaN, loc accessor, SettingWithCopyWarning.