Matplotlib库 标注在工作有很大作用:
Annotate的构造函数为 :Annotation(s, xy, xytext=None, xycoords=‘data’, textcoords=None, arrowprops=None, annotation_clip=None, **kwargs) 用于绘制连接图上两点的箭头。
关键参数:
- s 为注释文本内容
- xy 为被注释的坐标点,二维元组形如(x,y)
- xytext 为注释文本的坐标点,也是二维元组,默认与xy相同
- xycoords为被注释点的坐标系属性(通常xycoords值为’data’,即以被注释的坐标点xy为参考)
-
Value               Description
=================   =============================================
'figure points'     Points from the lower left of the figure
'figure pixels'     Pixels from the lower left of the figure
'figure fraction'   Fraction of figure from lower left
'axes points'       Points from lower left corner of axes
'axes pixels'       Pixels from lower left corner of axes
'axes fraction'     Fraction of axes from lower left
'data'              Use the coordinate system of the object being
                    annotated (default)
'polar'             *(theta, r)* if not native 'data' coordinates
=================   =============================================
-
- textcoords 设置注释文本的坐标系属性(textcoords 选择为相对于被注释点xy的偏移量,‘offset points’或者’offset pixels’)
arrowprops为箭头的样式,dict(字典)型数据,如果该属性非空,则会在注释文本和被注释点之间画一个箭头。如果不设置’arrowstyle’关键字,则允许包含关键字width、headwidth、headlength、shrink,以下是arrowstyle的可选值
-
Name           Attrs
============   =============================================
``'-'``        None
``'->'``       head_length=0.4,head_width=0.2
``'-['``       widthB=1.0,lengthB=0.2,angleB=None
``'|-|'``      widthA=1.0,widthB=1.0
``'-|>'``      head_length=0.4,head_width=0.2
``'<-'``       head_length=0.4,head_width=0.2
``'<->'``      head_length=0.4,head_width=0.2
``'<|-'``      head_length=0.4,head_width=0.2
``'<|-|>'``    head_length=0.4,head_width=0.2
``'fancy'``    head_length=0.4,head_width=0.4,tail_width=0.4
``'simple'``   head_length=0.5,head_width=0.5,tail_width=0.2
``'wedge'``    tail_width=0.3,shrink_factor=0.5
============   =============================================
两个点之间的连接路径。 这由connectionstyle键值控制。
Angle(angleA=90, angleB=0, rad=0.0)[source]
Angle3(angleA=90, angleB=0)
Arc(angleA=0, angleB=0, armA=None, armB=None, rad=0.0)
Arc3(rad=0.0)[source]
Bar(armA=0.0, armB=0.0, fraction=0.3, angle=None)[source]
pyplot模块(或Axes类的text方法get_bbox_patch/set_boxstyle("rarrow", pad=0.6))中的text()函数接受bbox关键字参数,并且在提供时,在文本周围绘制一个框。常用参数如下:

import matplotlib.pyplot as plt
import numpy as np
import matplotlib.path as mpath
import matplotlib.lines as mlines
import matplotlib.patches as mpatches
from matplotlib.collections import PatchCollection


def label(xy, text):
    y = xy[1] - 0.15  # shift y-value for label so that it's below the artist
    plt.text(xy[0], y, text, ha="center", family='sans-serif', size=14)


fig, ax = plt.subplots()
# create 3x3 grid to plot the artists
grid = np.mgrid[0.2:0.8:3j, 0.2:0.8:3j].reshape(2, -1).T

patches = []

# add a circle
circle = mpatches.Circle(grid[0], 0.1, ec="none")
patches.append(circle)
label(grid[0], "Circle")

# add a rectangle
rect = mpatches.Rectangle(grid[1] - [0.025, 0.05], 0.05, 0.1, ec="none")
patches.append(rect)
label(grid[1], "Rectangle")

# add a wedge
wedge = mpatches.Wedge(grid[2], 0.1, 30, 270, ec="none")
patches.append(wedge)
label(grid[2], "Wedge")

# add a Polygon
polygon = mpatches.RegularPolygon(grid[3], 5, 0.1)
patches.append(polygon)
label(grid[3], "Polygon")

# add an ellipse
ellipse = mpatches.Ellipse(grid[4], 0.2, 0.1)
patches.append(ellipse)
label(grid[4], "Ellipse")

# add an arrow
arrow = mpatches.Arrow(grid[5, 0] - 0.05, grid[5, 1] - 0.05, 0.1, 0.1,
                       width=0.1)
patches.append(arrow)
label(grid[5], "Arrow")

# add a path patch
Path = mpath.Path
path_data = [
    (Path.MOVETO, [0.018, -0.11]),
    (Path.CURVE4, [-0.031, -0.051]),
    (Path.CURVE4, [-0.115, 0.073]),
    (Path.CURVE4, [-0.03, 0.073]),
    (Path.LINETO, [-0.011, 0.039]),
    (Path.CURVE4, [0.043, 0.121]),
    (Path.CURVE4, [0.075, -0.005]),
    (Path.CURVE4, [0.035, -0.027]),
    (Path.CLOSEPOLY, [0.018, -0.11])]
codes, verts = zip(*path_data)
path = mpath.Path(verts + grid[6], codes)
patch = mpatches.PathPatch(path)
patches.append(patch)
label(grid[6], "PathPatch")

# add a fancy box
fancybox = mpatches.FancyBboxPatch(
    grid[7] - [0.025, 0.05], 0.05, 0.1,
    boxstyle=mpatches.BoxStyle("Round", pad=0.02))
patches.append(fancybox)
label(grid[7], "FancyBboxPatch")

# add a line
x, y = np.array([[-0.06, 0.0, 0.1], [0.05, -0.05, 0.05]])
line = mlines.Line2D(x + grid[8, 0], y + grid[8, 1], lw=5., alpha=0.3)
label(grid[8], "Line2D")

colors = np.linspace(0, 1, len(patches))
collection = PatchCollection(patches, cmap=plt.cm.hsv, alpha=0.3)
collection.set_array(np.array(colors))
ax.add_collection(collection)
ax.add_line(line)

plt.axis('equal')
plt.axis('off')
plt.tight_layout()

plt.show()
- boxstyle方框外形,参数是框样式的名称与其作为关键字参数的属性
- facecolor(简写fc)背景颜色
- edgecolor(简写ec)边框线条颜色
- edgewidth边框线条大小
box类 名称 属性
Circle circle pad=0.3
DArrow darrow pad=0.3
LArrow larrow pad=0.3
RArrow rarrow pad=0.3
Round round pad=0.3,rounding_size=None
Round4 round4 pad=0.3,rounding_size=None
Roundtooth roundtooth pad=0.3,tooth_size=None
Sawtooth sawtooth pad=0.3,tooth_size=None
Square square pad=0.3
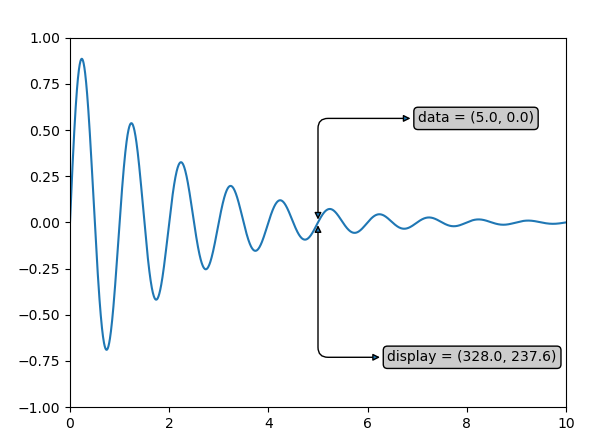
案例
import numpy as np
import matplotlib.pylab  as plt

x = np.arange(0, 10, 0.005)
y = np.exp(-x / 2.) * np.sin(2 * np.pi * x)

fig = plt.figure()
ax = fig.add_subplot(111)
ax.plot(x, y)
ax.set_xlim(0, 10)
ax.set_ylim(-1, 1)

xdata, ydata = 5, 0
xdisplay, ydisplay = ax.transData.transform_point((xdata, ydata))

bbox = dict(boxstyle="round", fc="0.8")
arrowprops = dict(arrowstyle="<|-|>",connectionstyle="angle,angleA=0,angleB=90,rad=10")

offset = 100
ax.annotate('data = (%.1f, %.1f)' % (xdata, ydata),
            xy=(xdata, ydata), xytext=(1 * offset, offset), textcoords='offset pixels',
            bbox=bbox, arrowprops=arrowprops)

disp = ax.annotate('display = (%.1f, %.1f)' % (xdisplay, ydisplay),
                   (xdisplay, ydisplay), xytext=(0.5 * offset, -offset),
                   xycoords='figure pixels',
                   textcoords='offset points',

                   bbox=bbox, arrowprops=arrowprops)

plt.show()