用途:一般我们画热图是以连续变量作为填充因子,complexHeatmap的oncopoint函数可以以类别变量作为填充因子作热图。
用法:oncoPrint(mat, get_type = function(x) x,alter_fun = alter_fun_list, alter_fun_list = NULL, col,row_order = oncoprint_row_order(),column_order = oncoprint_column_order(),show_column_names = FALSE,show_pct = TRUE, pct_gp = gpar(), pct_digits = 0,....)
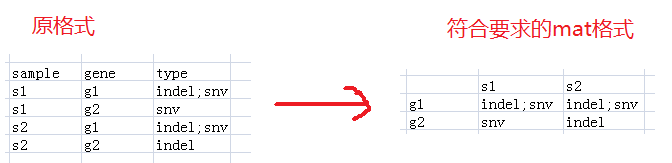
mat:类别矩阵。
get_type:得到数据中的类别。
alter_fun:函数list,具体说明每个类别要怎么画。
col:图例的颜色
第一步:写脚本把数据转换成符合要求的mat类型。
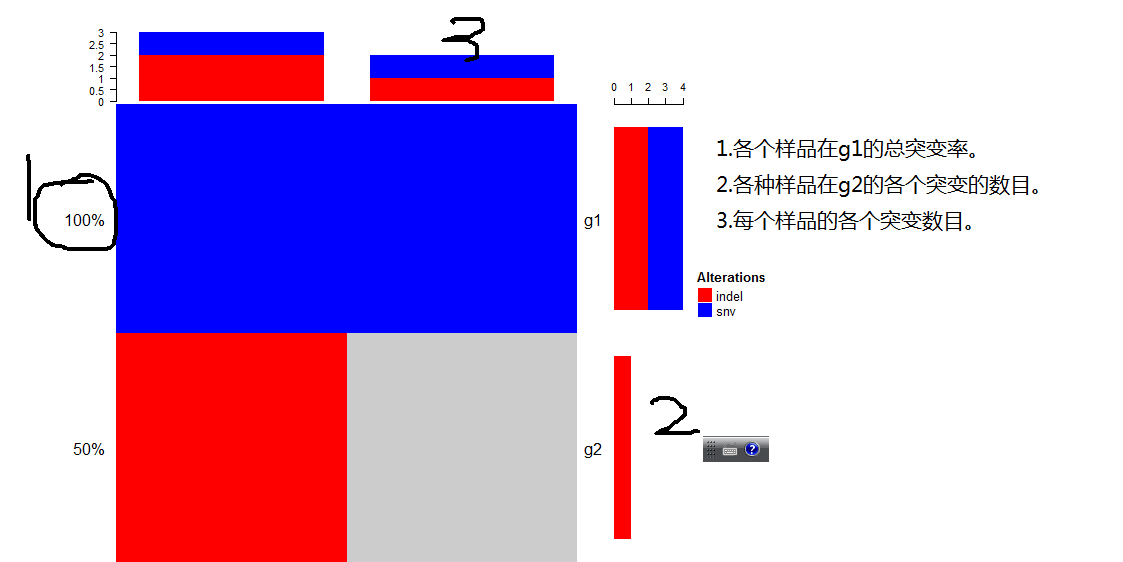
第二步:用oncoPrint函数画图。
alter_fun=list(
background=function(x,y,w,h){grid.rect(x,y,w,h,gp=gpar(fill="white",col=NA))}##针对NA设置
indel=function(x,y,w,h){grid.rect(x,y,w,h,gp=gpar(fill="red",col=NA))}
snv=function(x,y,w,h){grid.reat(x,y,w,h,gp=gpar(fill="blue",col=NA))})
col=c(indel="red",snv="blue")#图例的颜色,必须写明每个类别的颜色。
oncoPrint(mat,get_type=function(x) {strsplit(x,";")[[1]]},alter_fun=alter_fun,col=col)
参考文章:
http://www.bioconductor.org/packages/3.3/bioc/vignettes/ComplexHeatmap/inst/doc/s8.oncoprint.html