Dealing with dynamic memory traditionally has been one of the most awkward issues of C and C++ programming. It is not surprising that some supposedly easier languages, such as Java, have introduced garbage collection mechanisms that relieve programmers of this burden. But for hard-core C programmers, the GNU C library contains some tools that allow them to tune, check and track the usage of memory.
处理动态内存在c/c++编程中,一直被认为是一件很难操作的事情.在一些被认为是比较简单的编程语言,像Java,引入垃圾回收机制来减轻程序员的負担,也就不会让人觉得惊讶了.但是对一些c程序员来说,GUN C库包含一些工具,能够允许程序员调整,检查,以及跟踪内存的使用.
A process' memory usually is classified as either static, the size is predetermined at compile time, or dynamic, space is allocated as needed at runtime. The latter, in turn, is divided into heap space, where malloc()'d memory comes from, and stack, where functions' temporary work space is placed. As Figure 1 shows, heap space grows upward, whereas stack space grows downward.
一个进程的内存,通常被分为静态和动态两类.静态内存的大小在编译期就被已经确定了,而动态内存却是在运行时按需分配的.后者还可以被分为堆空间和栈空间,堆空间是用malloc分配得到的,而函数的临时工作空间被安置在栈上.如图1所示,堆空间向上增长,而栈空间向上增长.
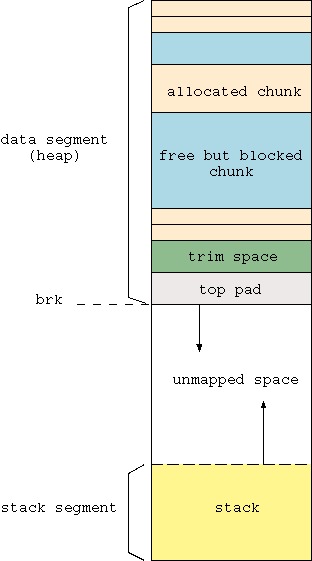
Figure 1. The heap and stack grow toward each other.
图1.堆和栈相向增长
When a process needs memory, some room is created by moving the upper bound of the heap forward, using the brk() or sbrk() system calls. Because a system call is expensive in terms of CPU usage, a better strategy is to call brk() to grab a large chunk of memory and then split it as needed to get smaller chunks. This is exactly what malloc() does. It aggregates a lot of smaller malloc() requests into fewer large brk() calls. Doing so yields a significant performance improvement. The malloc() call itself is much less expensive than brk(), because it is a library call, not a system call. Symmetric behavior is adopted when memory is freed by the process. Memory blocks are not immediately returned to the system, which would require a new brk() call with a negative argument. Instead, the C library aggregates them until a sufficiently large, contiguous chunk can be freed at once.
当一个进程需要内存时,通过brk()或sbrk()系统调用,移动堆的上边界,产生一些空间.因为一次系统调用是一个非常消耗cpu的操作,所以,一个比较好的策略就是,调用brk()来获取一大区块内存,然后按需切割他们来得到较小的内存区块.这就是malloc()函数的所作的事情.它将大量的小区块malloc操作聚集到较少的大块的brk()操作.这样做产生了显著的性能改善.malloc调用它自己比调用brk()的代价要小的多.因为前者是一个库调用,而不是一个系统调用.对称的动作也被使用在内存释放的时候.内存块并不立即返回给系统,如果要立即返回给系统,将需要调用brk(),并给它一个负的参数.相反,c库把这些内存块收集起来,直到足够的大,连续的内存区块可以一次全部释放.
For very large requests, malloc() uses the mmap() system call to find addressable memory space. This process helps reduce the negative effects of memory fragmentation when large blocks of memory are freed but locked by smaller, more recently allocated blocks lying between them and the end of the allocated space. In this case, in fact, had the block been allocated with brk(), it would have remained unusable by the system even if the process freed it.
对一些非常大的請求,malloc()使用mmap()系统调用来寻找可寻址的内存空间.这个处理方法帮助减少内存碎片的负面影响,内存碎片的产生是由于一大块内存被free,但是仍被一些小的,最近分配的,躺在这些大内存块和分配空间结束位置之间的这些小内存块锁定,在这种情况下,事实上,假设是使用brk()分配的,对系统来说不能使用,即使进程已经释放了它.
Library functions that deal with dynamic memory are not limited to malloc() and free(), although these are by far the most-used calls. Other available functions include realloc(), to resize an already allocated block; calloc(), to allocate a cleared block; and memalign(), posix_memalign() and valloc(), to allocate an aligned block.
库函数处理动态内存并不局限于malloc()和free(),尽管至今为止它们是最常使用的调用.其它一些可用的函数包括realloc(),可以用来重置已分配内存块的大小,calloc(),来分配一个被清0的内存块,以及memalign(),posix_align(),分配一个对齐内存块.
The strategy adopted by the C library memory management code is optimized for generic memory usage profiles. Although this strategy produces good performance in most cases, some programs might benefit from slightly different parameter tuning. First, check your memory usage statistics by using either the malloc_stats() or the mallinfo() library calls. The former prints as a standard error a brief summary of memory usage in the program. This summary includes how many bytes have been allocated from the system, gathered with brk(); how many are actually in use, found with malloc(); and how much memory has been claimed, using mmap(). Here is a sample output:
c库内存管理所采用的策略,为适合通用的内存使用情况而作了优化.尽管这个策略在大多数情况下性能表现良好,一些程序可能会从一些稍微不同函数调整中受益.首先,检查你的内存使用统计,通过使用malloc_stats()或是mallinfo()系统调用.前者以一个标准错误的方式,在程序中打印内存使用概要.这个概要包括通过brk(),多少字节从系统中分配出去;实际通过malloc使用的多少;以及使用mmap(),多少内存被声明使用.以面是一个简单的输出:
Arena 0:
system bytes     =     205892
in use bytes     =     101188
Total (incl. mmap):
system bytes     =     205892
in use bytes     =     101188
max mmap regions =          0
max mmap bytes   =          0
If you need to have more precise information and want to make more than a printout, mallinfo() is helpful. This function returns a struct mallinfo containing various memory-related status indicators; the most interesting are summarized in the Sidebar “Useful Parameters Provided by mallinfo”. For a complete description of the structure, take a look at /usr/include/malloc.h.
如果你还需要更精确的信息,并且想要更多的输入,mallinfo()就非常有用.这个函数返回一个maillinfo结构体,包含各种内存相关的状态指示器,最有趣的东西被总结在"Useful Parameters Provided by mallinfo".对这个结构休的完整描述,参见/usr/include/malloc.h.
Useful Parameters Provided by mallinfo()
mallinfo提供的有用的参数
Another useful function provided by libc is malloc_usable_size(), which returns the number of bytes you actually can use in a previously allocated memory block. This value may be more than the amount you originally requested, due to alignment and minimum size constraints. For example, if you allocate 30 bytes, the usable size is actually 36. This means you could write up to 36 bytes to that memory block without overwriting other blocks. This is an extremely awful and version-dependent programming practice, however, so please don't do it. The most useful application of malloc_usable_size() probably is as a debug tool. For example, it can check the size of a memory block passed from outside before writing to it.
另一个由libc提供的用的函数是malloc_usable_size(),它返回在一个预先分配的内存块里你实际能使用的字节数。这个值可能会比你最初请求的值要大,因为内存齐和最小内存分配值约束。例如,如果你分配30字节,但是可使用的的大小是36,这意味着你可以向那块内存写入36个字节而不会覆盖其它内存块。这是一个非常糟糕和依赖版本的编程实践,然而,请不要这要做。malloc_usable_size()最有用的使用可能是作为一个调试工具。例如,它能够在写入一个从外部传入的内存块之前,检查它的大小。
You can alter the behavior of the memory management functions by adjusting some of the parameters exposed by the mallopt() function (Listings 1 and 2).
你可以定制内存管理函数的行为,通过调整由mallopt()函数的参数。
Listing 1. Setting the Trim Threshold with mallopt()
1.使用mallopt()设置内存消减的阈值。
Listing 2. A smaller trim threshold might save space.
2. 一个更小的内存消减阈值可能节省内存空间。
The prototype of this function and a basic set of four parameters are part of the SVID/XPG/ANSI standard. The current GNU C library implementation (version 2.3.1 as of this writing) honors only one of them (M_MXFAST), leaving three out. On the other hand, the library provides four additional parameters not specified by the standard. Tunable parameters accepted by mallopt() are described in the Sidebar “Tunable Parameters for mallopt()”.
这个函数的原型以及四个参数的简单集合是SVID/XPG/ANSI标准的一部分。当前的GNU C库的实现(写本文时,版本号为2.3.1)只支持它们中的一个(M_MXFAST),而不支持其它三个。另一方面,这个库提供四个额外的参数,而不是通过标准指定。mallopt()接受的可调整的参数在下一章中有描述。
Tunable Paramenter for mallopt()
mallopt()可调整的参数
Allocation tuning is possible even without introducing mallopt() calls inside your program and recompiling it. This may be useful if you want to test values quickly or if you don't have the sources. All you have to do is set the appropriate environment variable before running the application. Table 1 shows the mapping between mallopt() parameters and environment variables, as well as some additional information. If you wish to set the trim threshold to 64KB, for example, you can run this program:
内存分配调整甚至可以不在你的程序中引入mallopt()调用和重新编译它。在你想快速测试一些值或者你没有源代码时,这非常有用。你仅需要做的是在运行程序前,设置合适的环境变量。表1展示mallopt()参数和环境变量的映射关系以及一些额外的信息。例如,如果你希望设置内存消减阈值为64k,你可以运行这个程序:
MALLOC_TRIM_THRESHOLD=65536 my_prog
Speaking of trimming, it is possible to trim the memory arena and give any unused memory back to the system by calling malloc_trim(pad). This function resizes the data segment, leaving at least pad bytes at the end of it and failing if less than one page worth of bytes can be freed. Segment size is always a multiple of one page, which is 4,096 bytes on i386. The size of the memory available to be trimmed is stored in the keepcost parameter of the struct returned by mallinfo(). Automatic trimming is done inside the free() function by calling memory_trim(), if the current value of keepcost is higher than the M_TRIM_THRESHOLD value, and by using the value of M_TOP_PAD as the argument.
说到内存消减,它可以通过调用malloc_trim(pad)消减内存区域,将任何未使用的内存返回给系统。这个函数重新设置了数据段的大小,在数据段尾部保留至少pad字节,并且当少于一个页大小的字节能够被释放时,将产生调用失败。段大小总是页大小的倍数,在i386上,页大小是4096字节。能够被消减的内存大小被保存在由mallinfo()返回的结构体的keepcost 字段上。如果当前keepcost的值比M_TRIM_THRESHOLD的值要大,那么在free()函数里通过调用memory_trim(),使用M_TOP_PAD的值作为参数,自动内存消减就被完成了。
Table 1. mallopt() Parameters Mapped to Environment Variables
| mallopt() option | Env var | Default value | Notes |
| M_TRIM_THRESHOLD | MALLOC_TRIM_THRESHOLD_ | 128KB | -1U disables |
| M_TOP_PAD | MALLOC_TOP_PAD_ | 0 | |
| M_MMAP_THRESHOLD | MALLOC_MMAP_THRESHOLD_ | 128KB | 0 disables |
| M_MMAP_MAX | MALLOC_MMAP_MAX_ | 64 | 0 disables |
Debugging memory is often one of the most time-consuming tasks when developing complex programs. The two basic aspects of this problem are checking memory corruption and tracing block allocation and release.
当开发复杂程序时,调试内存经常是一项非常耗时的任务。两个基本角度是检查内存越界和跟踪内存块分配和释放。
Memory corruption happens when writing to a location lying inside the legal data segment but outside the boundaries of the memory block you intended to use. An example is writing beyond an array's end. In fact, if you were to write outside the legal data segment, a segmentation fault would halt the program immediately or trigger the appropriate signal handler, allowing you to identify the misbehaving instruction. Memory corruption is thus more subtle, because it can pass unnoticed and cause a faulty behavior in a part of the program quite far from the offending part. For this reason, the sooner you detect it in the program, the higher your chances are of catching the bug.
内存破坏发生在,当向有效数据段内的一个内存位置写数据却写到了你意图使用的内存块的边界之外。一个例子就是写数据到数据尾部之后。事实上,如果你试图写数据到合法数据段之外,一个段错误将会立即中止你的程序,或者触发一个适合的信号处理,它允许你鉴别错误行为的指令。内存破坏也难以捉摸,因为它能够没有任何提示的通过导致内存越界的代码,并且在距离导致内存越界非常远的程序部分造成一个段错误的行为。
Corruption may affect other memory blocks (messing with the application data) and the heap management structures. In the former case, the only symptom that something is going wrong comes from analyzing your own data structures. In the latter case, you can rely on some specific GNU libc consistency check mechanisms that alert you when something wrong is detected.
Memory checking in a program can be enabled as automatic or manual. The former is done by setting the environment variable MALLOC_CHECK_:
内存破坏可能影响其它的内存块(扰乱程序数据)和堆管理结构。在前一个例子中,某些地方会出错的惟一症兆就是来自于分析你自己的数据结构。在接下来的例子中,你可以依赖于某些特定的GNU libc 连续性检查机制,当某些地方的错误被检测到的时候,它会发出警报。在程序中的内存检查能够通过手动或自动的启动。前一种情况可以通过设置环境变量来完成:
MALLOC_CHECK_=1 my_prog
This mechanism is able to catch a fair number of boundary overflows and, in some cases, to protect the program from crashing. The action undertaken when a fault is detected depends on the value of MALLOC_CHECK_: 1 prints a warning message to stderr but does not abort the program; 2 aborts the program without any output; and 3 combines the effects of 1 and 2.
这个机制能够捕获大多数的边界溢出并且,在某些情况下,可以避免程序崩溃。当一个错误被探测到的时候,这个机制所采取的行为依赖于MALLOC_CHECK的值,值为1时,打印一个警告信息到标准错误输出但是不会终止程序,值为2时,终止程序,没有任何输出,值为3时,是1和2效果的联合(打印警告信息,终止程序)。
Automatic checking takes place only when memory-related functions are invoked. That is, if you write beyond an array's end, it won't be noticed until the next malloc() or free() call. Also, not all the errors are caught, and the information you obtain is not always extremely useful. In the case of free(), you know which pointer was being freed when the error was detected, but that gives no hint whatsoever as to who trashed the heap. In the case of errors detected during an allocation, you merely receive a “heap corrupted” message.
只有当内存相关的函数被调用时,自动内存检查才会发生。也就是说,如果你向一个数据的尾部之后写数据,程序不会注意到,直到下个malloc()或者free()调用。同时,不是所有的错误被捕获,并且你得到的信息也不总是非常有用。在free()的情况下,当错误被探测到的时候,你知道哪个指针被释放掉,但是,那并没有给那些搞乱堆的人任何提示。在分配期间内存,探测到错误的情况下,你仅仅收到一个“堆被破坏”的消息。
The alternative is to place manual checkpoints here and there in the program. To do this, you must call the mcheck() function at the beginning of the program. This function allows you to install a custom memory fault handler that can be invoked each time heap corruption is detected. A default handler also is available if you don't provide your own. Once mcheck() has been called, all the consistency checks you get with MALLOC_CHECK_ are in place. Moreover, you can call the mprobe() function manually to force a check on a given memory pointer at any time. Values returned by mprobe() are summarized in the Sidebar “mprobe() Results”.
可以考虑的解决方法是放置手动检查点在程序的各个地方。为了这样做,你必须在程序的开始处调用mcheck()函数。这个函数允许你安装一个自定义的内存错误处理器,它能够在每次堆破坏被探测到的时候被调用。如果你不提供你自己的,也可以使用默认的处理器。一旦mcheck()被调用,你通过设置MALLOC_CHECK_得到的连续性检查就会生效。而且,你可以在任何时候调用手动的调用mprobe()函数来强制检查一个给定的内存指针。mprobe()的返回值被总结在下一章。
mprobe() 结果
If you want to check the whole heap and not only one block, you can call mcheck_check_all() to walk through all the active blocks. You also can instruct the memory management routines to use mcheck_check_all(), instead of checking only the current block by initializing mcheck_pedantic() instead of mcheck(). Be aware, though, that this approach is rather time consuming.
A third way to enable memory checking is to link your program with libmcheck:
如果你希望检查整个堆而不是一个内存块,你可以调用mcheck_check_all()来遍历所有的活动块。你也可以指导内存管理惯例,通过使用mcheck_check_all(),替代只检查当前内存块,同时使用mcheck_pedantic()而不是mcheck()来作初始化。注意,尽管这种方法是非常耗时的,第三种启用内存检查的方法是将你程序链接到libmcheck():
gcc myprog.c -o myprog -lmcheck
The mcheck() function is called automatically before the first memory allocation takes place—useful in those cases when some dynamic blocks are allocated before entering main().
在第一内存分配发生前,mcheck()函数被自动调用--当在进入main()之前,动态内存块被分配的情况下,非常有用。
Tracing the history of memory blocks helps in finding problems related to memory leaks and usage or release of already freed blocks. For this purpose, the GNU C library offers a tracing facility that is enabled by calling the mtrace() function. Once this call is made, every heap operation is logged to a file whose name must be specified in the environment variable MALLOC_TRACE. Analysis of the log file then can be performed off-line using a Perl script that is provided with the library and called, not surprisingly, mtrace. Logging can be stopped by calling muntrace(), but keep in mind that applying tracing to portions of your program may invalidate the result of post-processing. For example, false leaks may be detected if you allocate one block while tracing and then free it after muntrace().
跟踪内存块的历史有助于寻找到内存泄露和使用或释放一个已经释放的内存块相关的问题。为了这个目的,GNU C库提供了一个跟踪工具,它通过调用mtrace()生效。一旦调用了这个函数,每次堆操作将被记录到一个文件,此文件的名字必须在环境变量MALLOC_TRACE中指定。然后就可以在线下通过使用由库一起提供的一个Perl脚本和调用mtrace来完成日志文件分析。日志能够通过调用muntrace()函数来终止,但是时刻注意,在你的部分程序中应用内存跟踪可能导致你后面的处理结果失效。例如,如果你在跟踪期间分配一个内存块,然后在muntrace()之后释放它,就可能导致探测到一个虚假的内存泄露。
Listing 3. Tracing with mtrace()
3. 使用mtrace()跟踪
Here is a sample tracing session using the program in Listing 3:
这里有一个使用跟踪的简单程序:
$ gcc -g Listing_3.c -o Listing_3
$ MALLOC_TRACE="trace.log" ./Listing_3
$ mtrace trace.log
Memory not freed:
-----------------
   Address     Size     Caller
0x08049718      0xa  at malloc_debug/Listing_3.c:9
Memory tracing has nothing to do with protection from errors; calling mtrace() won't prevent the program from crashing. Even worse, if the program segfaults, the trace file is likely to be truncated and tracing may be inconsistent. To protect against this risk, it is always a good idea to install a SIGSEGV handler that calls muntrace(), because it closes the trace file before aborting (Listing 4). More information on memory tracing can be found on the libc info page.
内存跟踪与错误保护没有什么联系。调用mtrace()不会避免程序崩溃。甚至更糟的是,如果程序段错误,跟踪文件可能被截掉,并且跟踪也不是连续的。为了避免这个风险,安装一个SIGSEGV信号处理器是一个不错的主意,这个处理器会调用muntrace() ,因为它在终止程序之前关闭跟踪文件(第4节)。更多关于内存跟踪的信息可以在libc info page 上面找到。
Listing 4. Remember to call muntrace() in the SIGSEGV handler.
4.记着在SIGSEGV处理器中调用muntrace()
Sometimes the standard debugging facilities provided by the GNU C library may not be suited to the particular needs of your program. In this case, you can resort either to an external memory debugging tool (see Resources) or carve your own inside the library. Doing this is simply a matter of writing three functions and hooking them to these predefined variables:
一些GNU C库提供的标准调试工具可能并不适合你程序的特殊需求。在这种情况下,你可以借助一个外部的内存调试工具(见 Resource)或者在你的库内部作修改。做这件事中只是简单的写三个函数以及将它们与预先定义的变量相关联:
-
__malloc_hook points to a function to be called when the user calls malloc(). You can do your own checks and accounting here, and then call the real malloc() to get the memory that was requested.
__malloc_hook 指向一个函数,当用户调用malloc()时,这个函数将被调用。你可以在这里做你自己的检查和计数,然后调用真实的malloc来得到被请求的内存。
-
__free_hook points to a function called instead of the standard free().
__free_hook 指向一个函数,用来替换标准的free()
-
__malloc_initialize_hook points to a function called when the memory management system is initialized. This allows you to perform some operations, say, setting the values of the previous hooks, before any memory-related operation takes place.
__malloc_initialize__hook 指向一个函数,当内存管理系统被初始化的时候,这个函数被调用。这允许你来实施一些操作,例如,在任何内存相关的操作生效前,设置前面的勾子值。
Hooks also are available for other memory-related calls, including realloc(), calloc() and so on. Be sure to save the previous values of the hooks and restore them before calling malloc() or free() inside your routines. If you fail to do so, infinite recursion prevents your code from working. Have a look at the example given in the libc info page for memory debugging to see all the nifty details.
在其它的内存相关的调用中,Hooks()也有效,包括realloc(),calloc()等等。确保在调用malloc()或free()之前,保存先前的勾子的值,把它们存储起来。如果你不这么做,你的程序将陷入无尽的递归。看看libc info page给的一个内存调试的例子来看看相关细节。
As a final note, consider that these hooks also are used by the mcheck and mtrace systems. It's a good idea to be careful when using all of them combined.
最后一点,勾子也被mcheck和mtrace系统使用。在使用所有它们的组合的时候,小心是没错的。
The GNU C library offers several extensions that turn out to be quite useful when dealing with memory. If you want to fine-tune your application's memory usage or build a memory debugging solution tailored to your needs, you probably will find these tools helpful or, at least, a good starting point to develop your own mechanisms.
GNU C库提供几种扩展,在处理内存时,它们被证明是非常有用的。如果你希望很好的调整你程序的内存使用,或是构建一个内存调试解决方法使之适合你的需求,你可能将会发现这些工具很有用,或者,至少是开发你自己的机制时一个不错的出发点。

Gianluca Insolvibile has been a Linux enthusiast since kernel 0.99pl4. He currently deals with networking and digital video research and development.
来源:http://blog.csdn.net/amwihihc/article/details/7481656