帮高中同学绘了张图,学到不少,记录一下
import matplotlib.pyplot as plt
import numpy as np
from matplotlib.pyplot import MultipleLocator
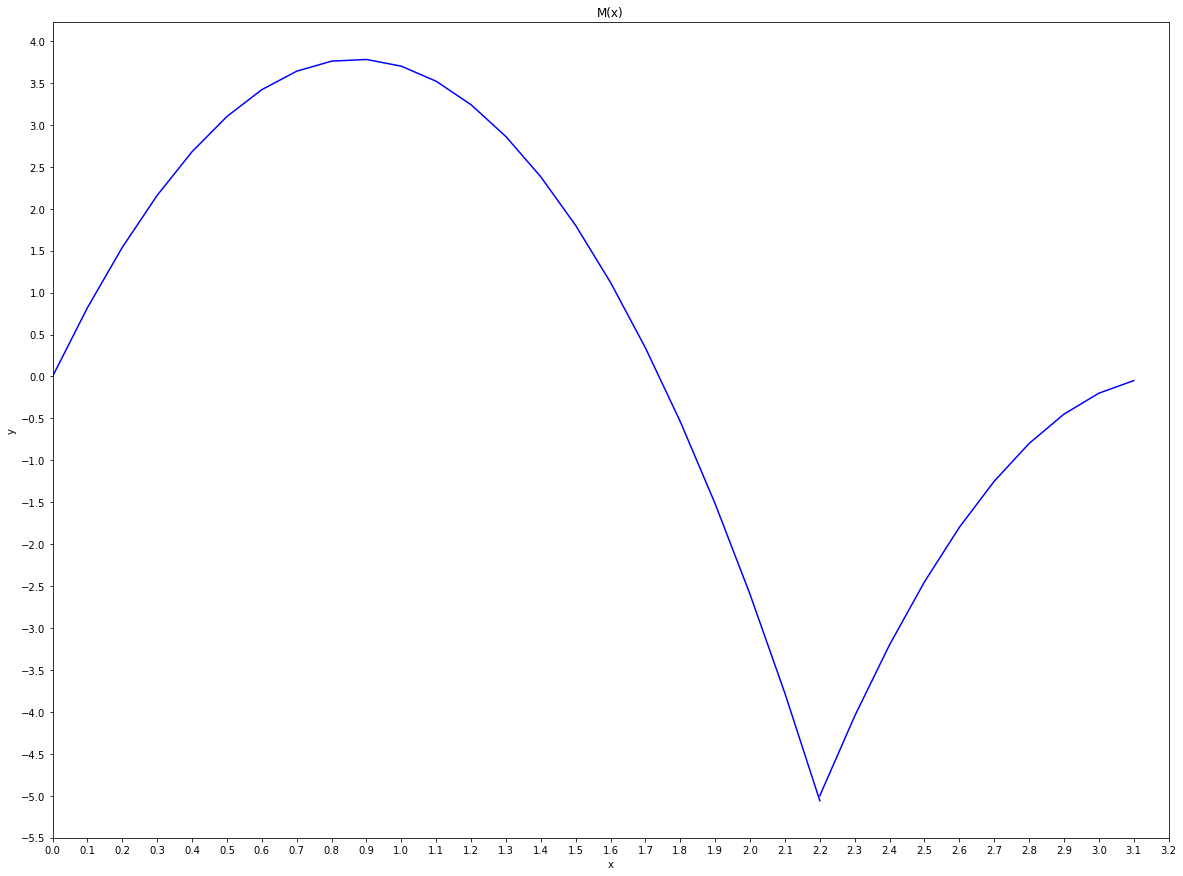
x1 = np.arange(0, 2.3, 0.1)
x2 = np.arange(2.2, 3.2, 0.1)
y1 = 8.7 * x1 - 5 * x1 ** 2
y2 = 32 * x2 - 5 * x2 ** 2 - 51.2
fig = plt.figure(figsize=(20, 15))
ax = fig.add_subplot(111)
plt.plot(x1, y1,color='blue')
plt.plot(x2, y2,color='blue')
plt.xlabel('x')
plt.ylabel('y')
plt.title("M(x)")
x_major_locator=MultipleLocator(0.1)
y_major_locator=MultipleLocator(0.5)
ax=plt.gca()
ax.xaxis.set_major_locator(x_major_locator)
ax.yaxis.set_major_locator(y_major_locator)
plt.xlim(0,3.2)
plt.show()