介绍
在ArcGIS Runtim SDK for .NET 10.2.6中,新添加了三维地图功能。在ArcGIS中,我们将三维地图称为Scene(场景),所以在Runtime SDK SDK for .NET中提供SceneView和Scene控件来显示三维数据,类似于在二维地图中的MapView和Map控件。而且在三维场景中能实现大多数二维地图下的功能。
显示场景
场景的显示由位置和观察者(observer)的属性决定,同过Canera这个类实现。下面的camera(相机)的特征用于显示三维的场景。
–Location,表示相机在表面上的位置(x,y坐标)
–Heading表示相机水平的朝向角度
–Pitch表示相机镜头与垂直线的角度
–Evevation表示高程(z) 
ps:实际在camera.Location中可以设置z。
加载地图
在三维场景中可以加载二维的地图,三维的模型以及高程数据。 

在xaml中添加加载地图代码:
<esri:Scene x:Name="scene1">
                    <esri:Scene.Surface>
                        <esri:ServiceElevationSource                     ServiceUri="http://elevation3d.arcgis.com/arcgis/rest/services/WorldElevation3D/Terrain3D/ImageServer" IsEnabled="True" ID="elevationLayer" />
                    </esri:Scene.Surface>
                    <esri:ArcGISTiledMapServiceLayer x:Name="TiledMap1"                   ServiceUri="http://services.arcgisonline.com/ArcGIS/rest/services/World_Street_Map/MapServer"/>
                    <esri:SceneLayer                 ServiceUri="http://scene.arcgis.com/arcgis/rest/services/Hosted/Buildings_Philadephia/SceneServer/layers/0"/>
</esri:Scene>- 1
- 2
- 3
- 4
- 5
- 6
- 7
- 1
- 2
- 3
- 4
- 5
- 6
- 7
在场景中显示图形
添加图形
图形可以添加到Scene的GraphicsLayer,或者SceneView的GraphicsOverlay。每个图形有一个几何,一系列属性和渲染需要的符号。下面的例子展示创建一个点图形,并设置几何和符号,最后添加到SceneView的GraphicsOverlay。 
public MainWindow()
        {
            InitializeComponent();
            // create a new point (MapPoint); pass x, y, and z coordinates in the constructor
            var newPoint = new MapPoint(-117.334, 34.55, 6000);

            // create a red "X" marker symbol
            var xMarkerSym = new SimpleMarkerSymbol();
            xMarkerSym.Color = Colors.Red;
            xMarkerSym.Size = 34;
            xMarkerSym.Style = SimpleMarkerStyle.X;

            // create a new graphic; assign the point and the symbol in the constructor
            var graphic = new Graphic(newPoint, xMarkerSym);

            // get a graphics overlay in the scene view and add the graphic
            var overlay = MySceneView.GraphicsOverlays["MyGraphicsOverlay"];
            overlay.Graphics.Add(graphic);
        }
- 1
- 2
- 3
- 4
- 5
- 6
- 7
- 8
- 9
- 10
- 11
- 12
- 13
- 14
- 15
- 16
- 17
- 18
- 19
- 20
- 1
- 2
- 3
- 4
- 5
- 6
- 7
- 8
- 9
- 10
- 11
- 12
- 13
- 14
- 15
- 16
- 17
- 18
- 19
- 20
渲染
渲染决定了图层上图形的样式。渲染器可以使用单一的符号来渲染所有的要素,或者使用含有逻辑的方式来定义不同属性的要素。 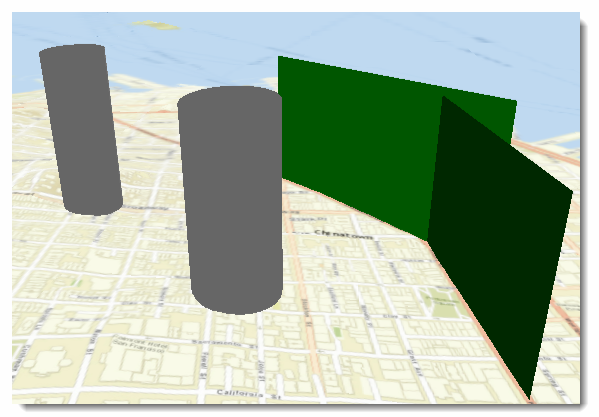
<esri:GraphicsLayer ID="GraphicsLayer" >
    <esri:GraphicsLayer.Renderer>
        <esri:SimpleRenderer>
            <esri:SimpleRenderer.Symbol>
                <esri:SphereMarkerSymbol Color="#FFFF99" Radius="1000" AnchorPosition="Top" />
            </esri:SimpleRenderer.Symbol>
        </esri:SimpleRenderer>
    </esri:GraphicsLayer.Renderer>
</esri:GraphicsLayer>
- 1
- 2
- 3
- 4
- 5
- 6
- 7
- 8
- 9
- 10
- 1
- 2
- 3
- 4
- 5
- 6
- 7
- 8
- 9
- 10
查询功能
在Runtime SDK for .NET中虽然不直接支持对三维模型的查询,但是我们可以通过将二维要素符号化后实现对三维属性的查询和三维建筑的高亮显示。 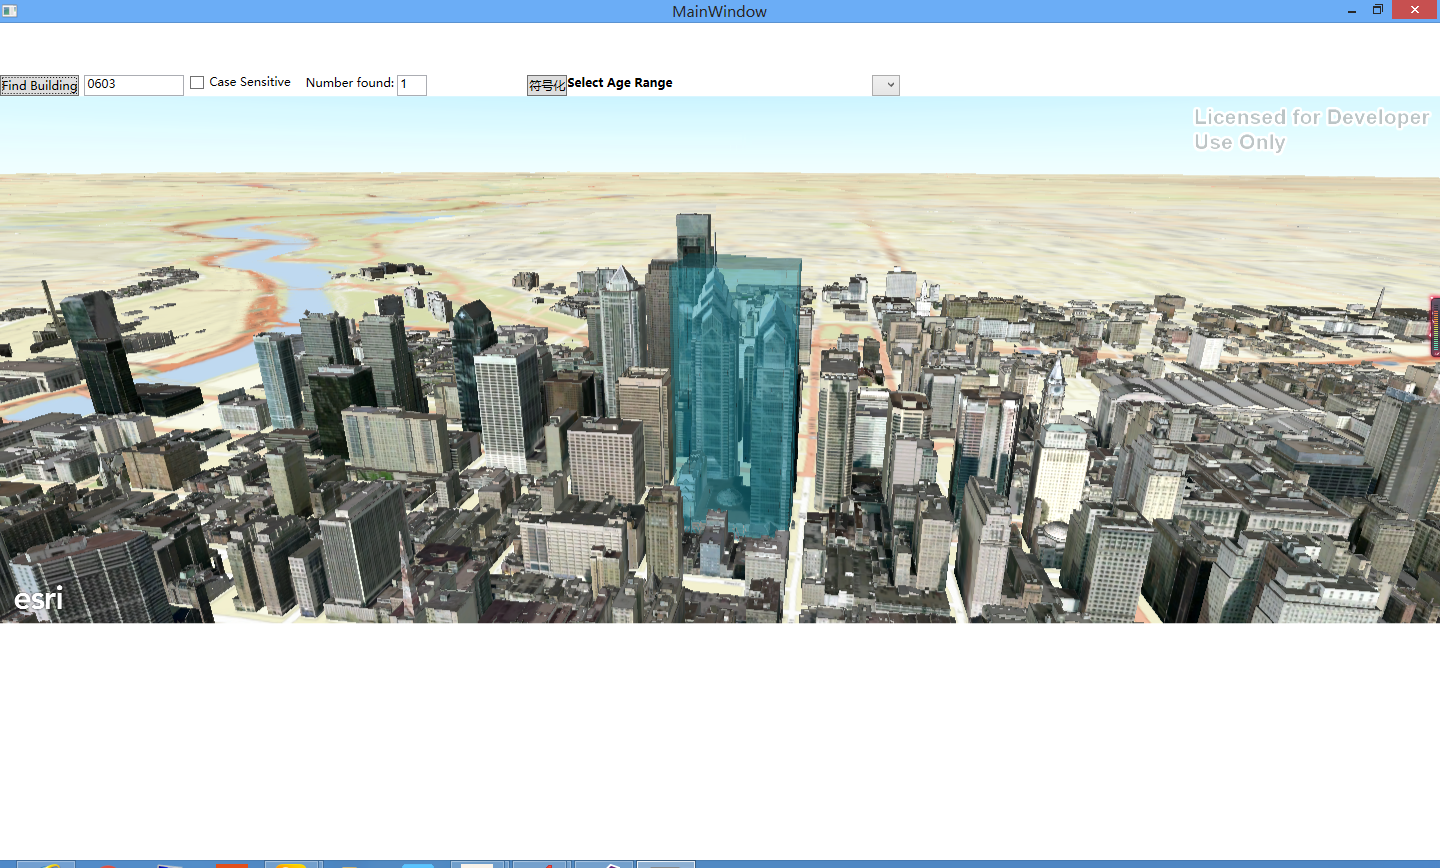
查询代码
Esri.ArcGISRuntime.Layers.GraphicsLayer myGraphicsLayer = (Esri.ArcGISRuntime.Layers.GraphicsLayer)scene1.Layers["myGraphicsLayer"];
            if(myGraphicsLayer!=null)
                myGraphicsLayer.Graphics.Clear();
            Uri myUri = new Uri("http://localhost:6080/arcgis/rest/services/Feature_Philadelphia/MapServer");
            FindParameters myFinfParameters = new FindParameters();
            myFinfParameters.SearchText = "philly_"+TextBox1.Text+".flt";
            List<int> myLayerIds = new List<int>();
            myLayerIds.Add(0);
            myFinfParameters.LayerIDs = myLayerIds;
            if (CheckBox1.IsChecked == true)
            {
                myFinfParameters.Contains = false;
            }
            else
            {
                myFinfParameters.Contains = true;
            }
            List<string> mySearchFields = new List<string>();
            mySearchFields.Add("Name");
            myFinfParameters.SearchFields = mySearchFields;
            FindTask myFindTask = new FindTask(myUri);
            FindResult myFindResult = await myFindTask.ExecuteAsync(myFinfParameters);
            IReadOnlyList<FindItem> myFindItems = myFindResult.Results;
            TextBox2.Text = myFindItems.Count.ToString();
            myGraphicsLayer = (GraphicsLayer)scene1.Layers["myGraphicsLayer"];
            var states = new GraphicCollection();
            foreach(FindItem oneFindItem in myFindItems)
            {
                states.Add(new Graphic(oneFindItem.Feature.Geometry, oneFindItem.Feature.Attributes));
                MapPoint mylocation = new MapPoint(oneFindItem.Feature.Geometry.Extent.GetCenter().X,          oneFindItem.Feature.Geometry.Extent.GetCenter().Y-2000,370,             oneFindItem.Feature.Geometry.Extent.GetCenter().SpatialReference);
                var viewpoint1 = new Camera(                      mylocation,0,73.16171159612496);
                await MySceneView.SetViewAsync(viewpoint1, 4, true);
            }
            await MySceneView.LayersLoadedAsync();
            var statesOverlay = MySceneView.GraphicsOverlays["statesOverLayer"];
statesOverlay.GraphicsSource = states;- 1
- 2
- 3
- 4
- 5
- 6
- 7
- 8
- 9
- 10
- 11
- 12
- 13
- 14
- 15
- 16
- 17
- 18
- 19
- 20
- 21
- 22
- 23
- 24
- 25
- 26
- 27
- 28
- 29
- 30
- 31
- 32
- 33
- 34
- 35
- 36
- 1
- 2
- 3
- 4
- 5
- 6
- 7
- 8
- 9
- 10
- 11
- 12
- 13
- 14
- 15
- 16
- 17
- 18
- 19
- 20
- 21
- 22
- 23
- 24
- 25
- 26
- 27
- 28
- 29
- 30
- 31
- 32
- 33
- 34
- 35
- 36
二三维联动
在ArcGIS Runtime SDK for .NET中,在一个窗体中可以添加两个视图,这里我添加了一个SceneView和 一个MapView实现二三维的联动。 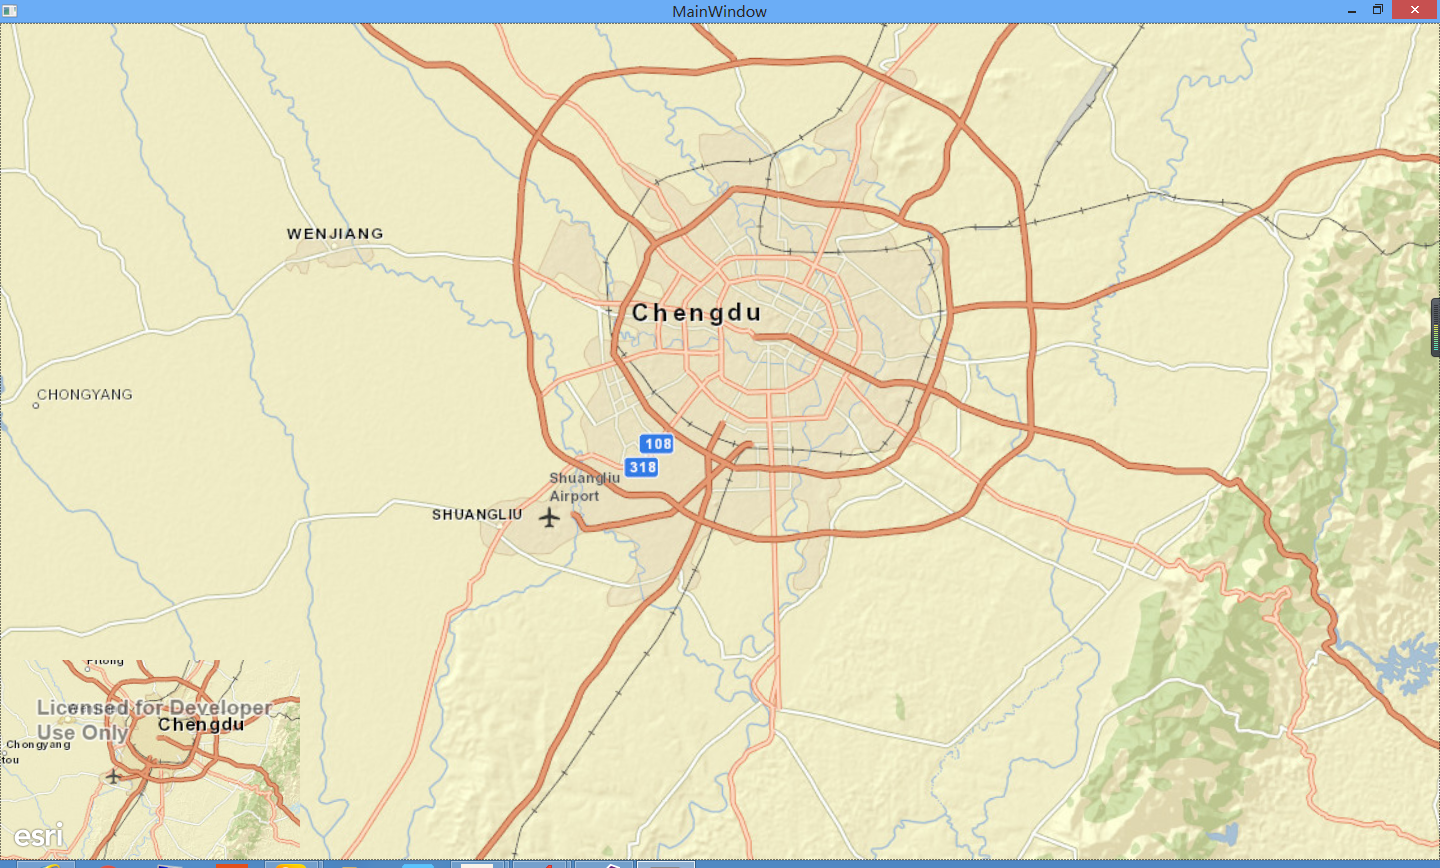
我们可以通过地图控件的SpatialReferenceChanged来监控地图的变化。
private async void MySceneView1_CameraChanged(object sender, EventArgs e)
        {
            var currentViewpoint = MySceneView1.GetCurrentViewpoint(ViewpointType.BoundingGeometry);
MyMapView1.SetViewAsync(currentViewpoint);
        }

private async void MyMapView1_ExtentChanged(object sender, System.EventArgs e)
        {
            var viewpoint1 = MyMapView1.GetCurrentViewpoint(ViewpointType.BoundingGeometry);
            await MySceneView1.SetViewAsync(viewpoint1);
}- 1
- 2
- 3
- 4
- 5
- 6
- 7
- 8
- 9
- 10
- 11
- 1
- 2
- 3
- 4
- 5
- 6
- 7
- 8
- 9
- 10
- 11
三维符号的属性查询
同二维的符号一样三维的符号的属性也可以进行查询。下面是获取的美国各州不同年龄段人口的数量。我们可以用三维的符号将人口数直观的表现出来。还可以点击符号,显示出这是哪个州,这个年龄段的人口的数量。例如:图中显示是阿拉斯加州,5-17岁的人口是143126。 
属性查询代码
GraphicsOverlay myGraphicsOverlay = MySceneView.GraphicsOverlays["statesOverlay"];
            myGraphicsOverlay.ClearSelection();
            Graphic myGraphic = await myGraphicsOverlay.HitTestAsync(MySceneView, e.Position);
            if (myGraphic != null)
            {
                myGraphic.IsSelected = true;
                IDictionary<string, object> myAttributes = myGraphic.Attributes;
                StringBuilder myStringBuilder = new System.Text.StringBuilder();
                foreach (var oneAttribute in myAttributes)
                {
                    if (statisticsComboBox.Text.ToString() == oneAttribute.Key.ToString() || oneAttribute.Key.ToString() == "STATE_NAME")
                        myStringBuilder.AppendLine(oneAttribute.Key.ToString() + ": " + oneAttribute.Value.ToString());
                }
                MessageBox.Show(myStringBuilder.ToString());
            }