原文链接:http://tecdat.cn/?p=17526
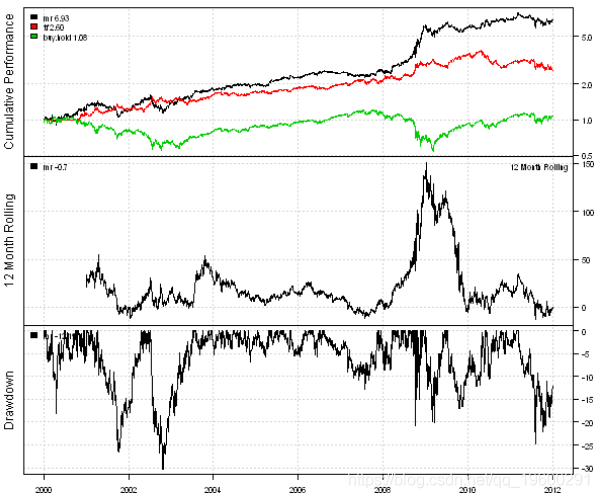
本文提出了一种算法,可以根据市场波动性在均值回归和趋势跟随策略之间进行切换。研究了两种模型:一种使用历史波动率,另一种使用Garch(1,1)波动率预测。均值回归策略使用RSI(2)建模:RSI(2)时为Long,否则为Short。趋势跟踪策略以SMA 50/200交叉建模:当SMA(50)> SMA(200)时为Long,否则为Short。
以下代码从Yahoo Fiance加载历史价格,并比较买入和持有,均值回归和趋势跟踪策略的效果:
-
-
#*****************************************************************
-
# 加载历史数据
-
#******************************************************************
-
load.packages('quantmod')
-
tickers = 'SPY'
-
-
data <- new.env()
-
getSymbols(tickers, src = 'yahoo', from = '1970-01-01', env = data, auto.assign = T)
-
-
#*****************************************************************
-
# 代码策略
-
#******************************************************************
-
prices = d
-
# 购买并持有
-
data$weight[
-
-
# 均值回归(MR)策略
-
rsi2 = bt.apply.ma
-
-
# 趋势跟踪(TF)策略
-
sma.short = apply.matrix(prices, SMA, 50)
-
sma.long = apply.matrix(prices, SMA, 200)
-
data$weight[] = NA
-
-
#*****************************************************************
-
# 创建报告
-
#******************************************************************
-
plotb
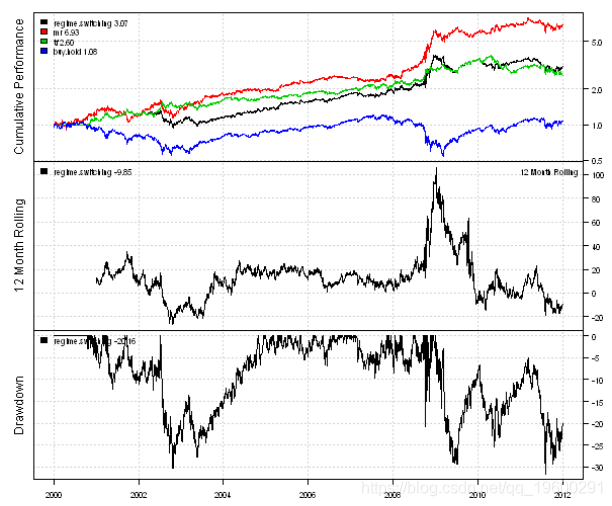
接下来,让我们创建一个基于历史市场波动性在均值回归和趋势跟随策略之间切换的策略。
-
#*****************************************************************
-
#根据历史市场波动情况进行区制转移
-
#使用252天的回溯期按百分比对当前波动率进行分类
-
#******************************************************************
-
-
-
# #区制转移历史
-
data$weight[] = NA
-
data$weight[] = iif(vol.rank > 0.5,
-
iif(rsi2 <
-
-
l=capital, trade.summary=T)
-
-
#*****************************************************************
-
#创建报告
-
#******************************************************************
-
report(regime, mr)
接下来,我们创建一个GARCH(1,1)波动率预测。
有一些R包可以适合GARCH模型。我将考虑tseries软件包中的garch函数和fGarch软件包中的garchFit函数。tseries软件包中的garch函数速度很快,但并不总能找到解决方案。fGarch软件包中的garchFit函数速度较慢,但收敛得更加一致。为了演示garch函数和garchFit函数之间的速度差异,我创建了一个简单的基准测试:
-
#*****************************************************************
-
# 基准化Garch算法
-
#******************************************************************
-
temp = garchSim(n=252)
-
-
test1 <- function() {
-
fit1=garch(temp, order = c(1, 1), control = garch.control(trace = F))
-
}
-
test2 <- function() {
-
fit2=garchFit(~ garch(1,1), data = temp, include.mean=FALSE, trace=F)
-
}
-
-
benchmark(
-
test1(),
-
test2(),
-
columns=
-
)
garchFit函数平均比garch函数慢6倍。因此,要预测波动率,我将尝试在找到解决方案时使用garch函数,否则将尝试使用garchFit函数。
-
#*****************************************************************
-
#使用Garch预测波动率
-
#来自tseries的garch速度很快,但是并不能始终收敛
-
#fGarch的garchFit速度较慢,但收敛一致
-
#******************************************************************
-
load.packages('tseries,fGarch')
-
-
# Sigma[t]^2 = w + a* Sigma[t-1]^2 + b*r[t-1]^2
-
garch.predict.one.day <- function(fit, r1) {
-
hl = tail( fitted(fit)[,1] ,1)
-
-
# 与预测相同( fit, n.ahead=1, doplot=F)[3]
-
garchFit.predict.one.day <- funct
-
-
garch.vol = NA * hist.vol
-
for( i in (252+1):nperiods
-
-
err ) FALSE, warning=function( warn ) FALSE )
-
-
if( !is.logical( fit
-
-
garch(1,1), data = temp, include.mean=FALSE, trace=F),
-
error=function( err ) FALSE, warning=function( warn ) FALSE )
-
-
if( !is.logical(
-
-
现在,让我们创建一个基于GARCH(1,1)波动率预测在均值回归和趋势跟踪策略之间切换的策略。
-
#*****************************************************************
-
# 使用Garch进行区制转移
-
#******************************************************************
-
vol.rank = percent.rank(SMA(percent.rank(garch.v
-
# 区制转移Garch
-
data$weight[] = NA
-
data$weight[] = iif(vol.rank > 0.5,
-
iif(rsi2 < 50, 1, -1),
-
iif(sma.short > sma.l
-
-
-
-
#*****************************************************************
-
#创建报告
-
#******************************************************************
-
report(regime.switching)
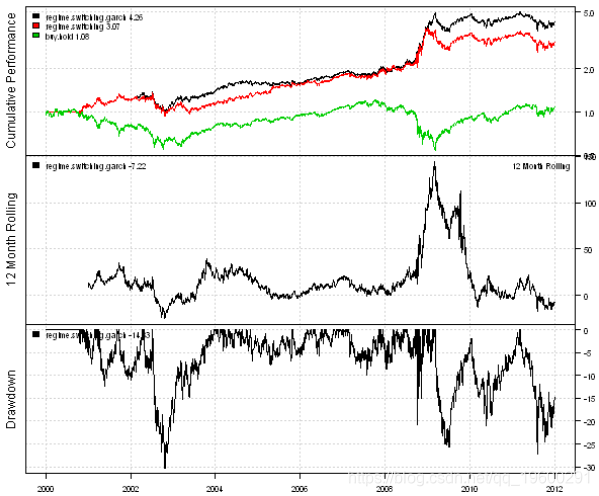
使用GARCH(1,1)波动率预测的转换策略要比使用历史波动率的策略稍好。
您可以采用多种不同的方法将预测合并到模型和交易策略中。R有非常丰富的软件包集,用于建模和预测时间序列。

最受欢迎的见解
1.HAR-RV-J与递归神经网络(RNN)混合模型预测和交易大型股票指数的高频波动率
2.R语言中基于混合数据抽样(MIDAS)回归的HAR-RV模型预测GDP增长
4.R语言ARMA-EGARCH模型、集成预测算法对SPX实际波动率进行预测
8.matlab预测ARMA-GARCH 条件均值和方差模型
9.R语言对S&P500股票指数进行ARIMA + GARCH交易策略
![]()