原文链接:http://tecdat.cn/?p=7598
以下是创建图表,检测其中的社区,然后在少于10行的python中使用由其社区着色的节点进行可视化的方法:
import networkx as nx
import community

G = nx.random_graphs.powerlaw_cluster_graph(300, 1, .4)

part = community.best_partition(G)
values = [part.get(node) for node in G.nodes()]

nx.draw_spring(G, cmap = plt.get_cmap('jet'), node_color = values, node_size=30, with_labels=False)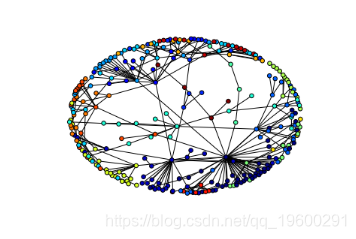
![]()
mod = community.modularity(part,G)
print("modularity:", mod)给了modularity: 0.8700238252368541。