一、zabbix自定义监控模板
# 强制刷新自定义监控项
[root@zabbix plugins]# zabbix_server -R config_cache_reload
zabbix_server [62586]: command sent successfully

#设置监控项刷新时间
二、zabbix监控nginx
1.安装
2.配置nginx状态页
    server {
        listen 80;
        server_name localhost;
        root /usr/share/nginx/html;

        location /nginx_status {
                stub_status;			# 添加nginx状态监控模块
        }
    }

[root@web01 ~]# systemctl restart nginx
3.nginx状态页
[root@web01 ~]# curl 10.0.0.7/nginx_status
Active connections: 3
server accepts handled requests
 		3 		3 		3
Reading: 0 Writing: 1 Waiting: 2
4.使用脚本
[root@web01 ~]# mkdir /scripts
[root@web01 ~]# cd /scripts/
[root@web01 scripts]# rz nginx_status.sh			# 脚本中定义监控网页监控项
[root@web01 scripts]# chmod +x nginx_status.sh
5.配置监控项
# 在客户端监控文件中使用脚本方式对nginx进行监控
[root@web01 ~]# vim /etc/zabbix/zabbix_agentd.d/nginx_status.conf
UserParameter=nginx_status[*],/bin/bash /scripts/nginx_status.sh $1

# 使客户端监控文件生效,需要对zabbix-agent进行重启
[root@web01 ~]# systemctl restart zabbix-agent.service
6.测试监控项
#客户端测试
[root@web01 ~]# zabbix_agentd -t nginx_status[active]
nginx_status[active]                          [t|1]

#服务端测试
[root@zabbix plugins]# zabbix_get -s 172.16.1.7 -k nginx_status[active]
1
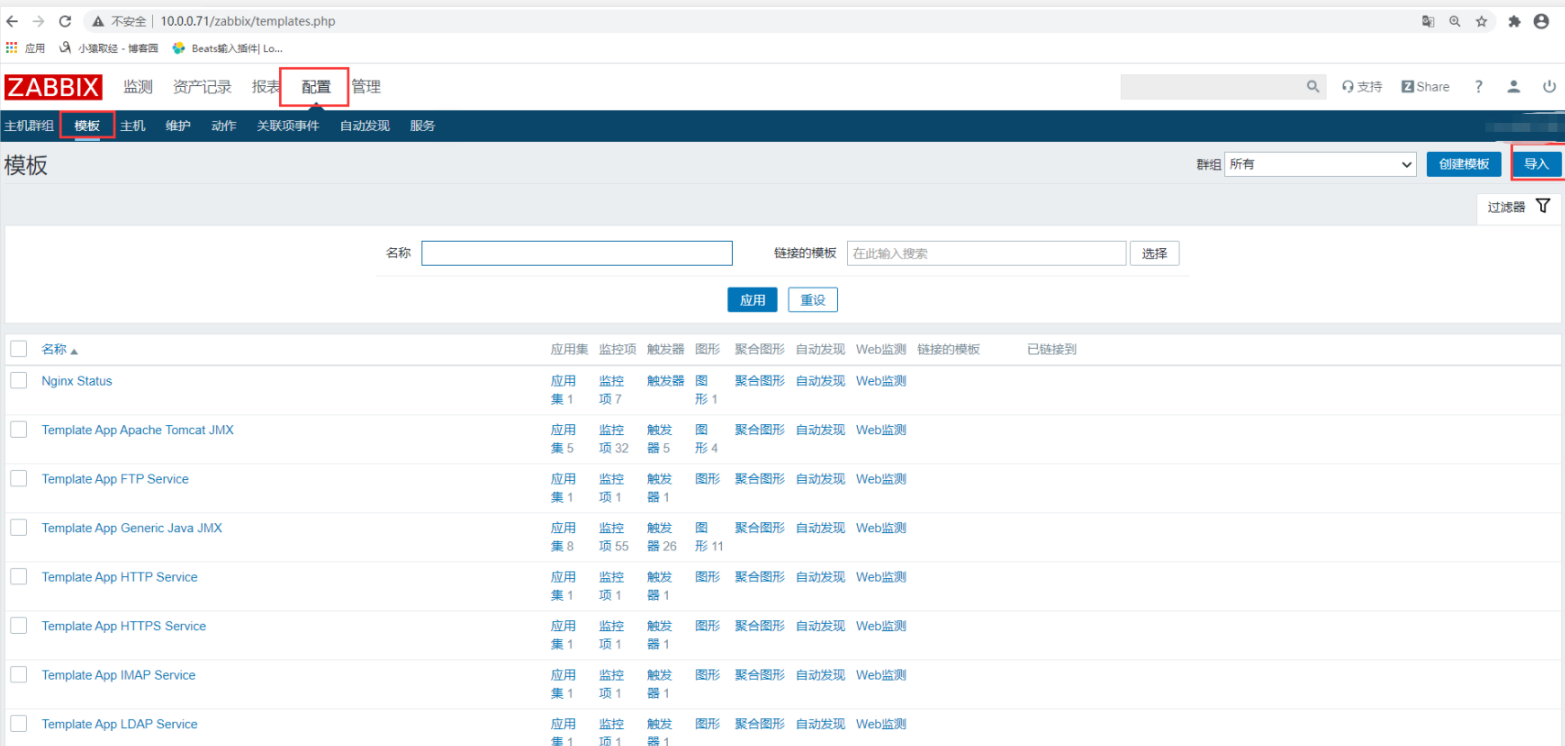
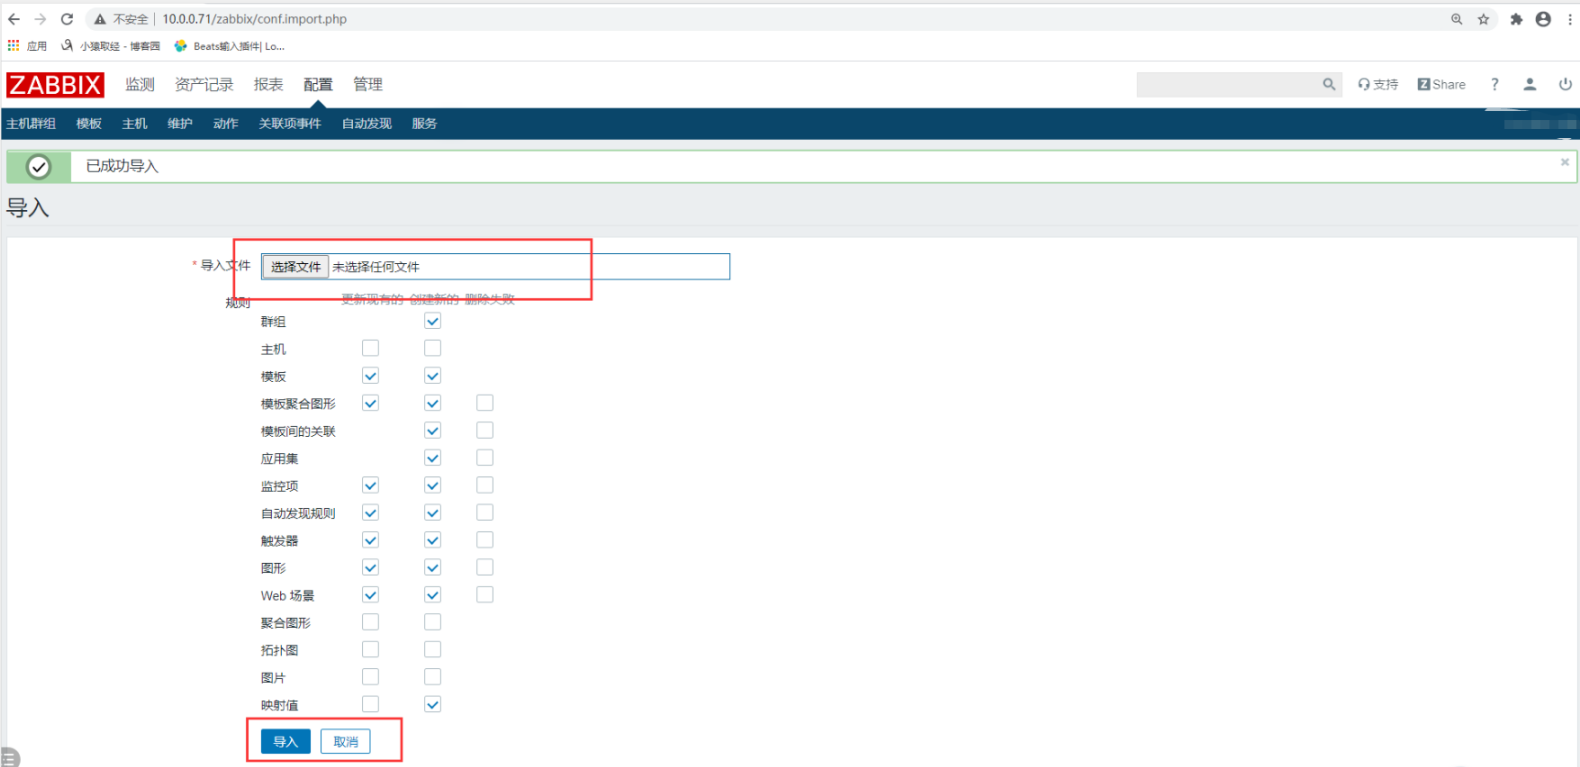
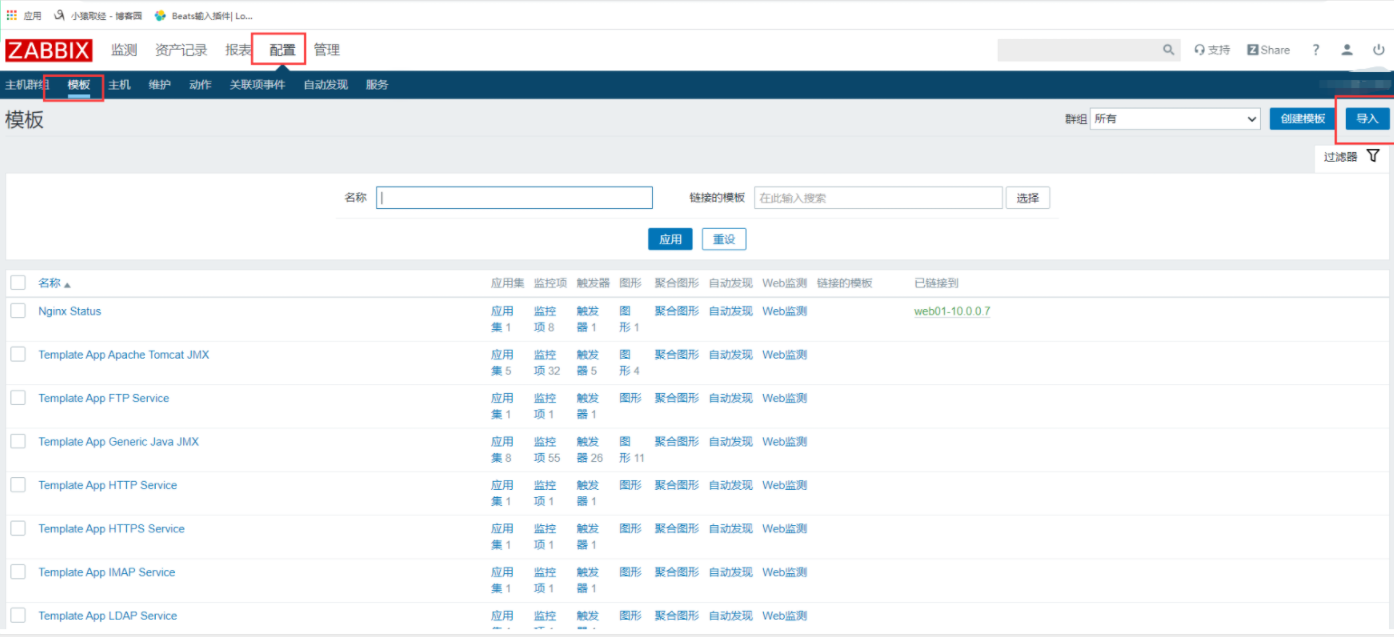
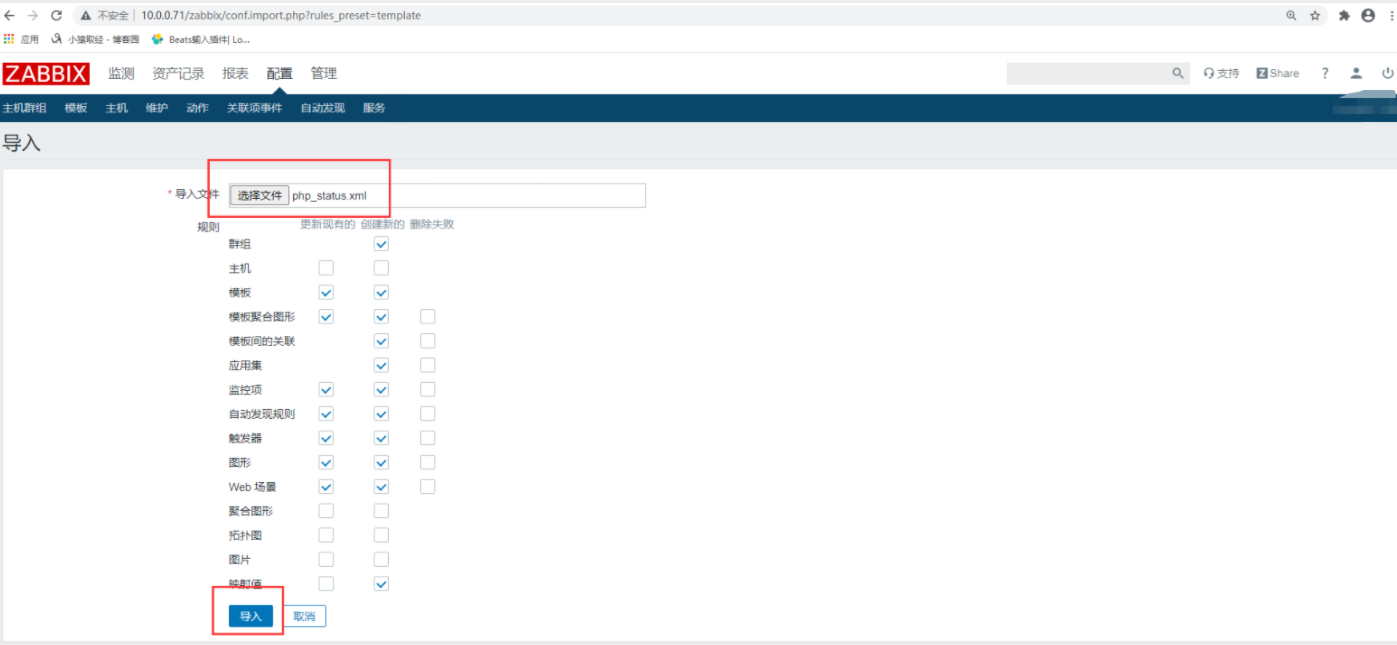
7.导入模板
- 模板文件中为针对nginx监控项的配置,直接导入模板使用即可
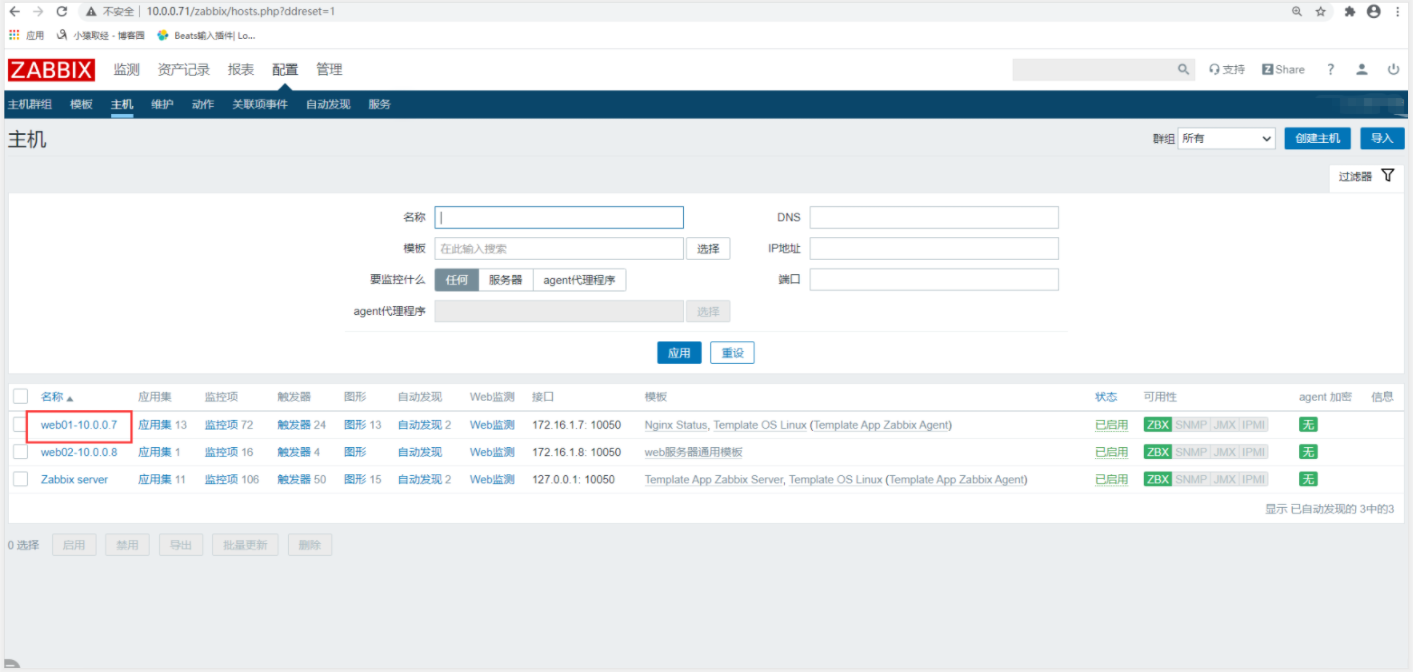
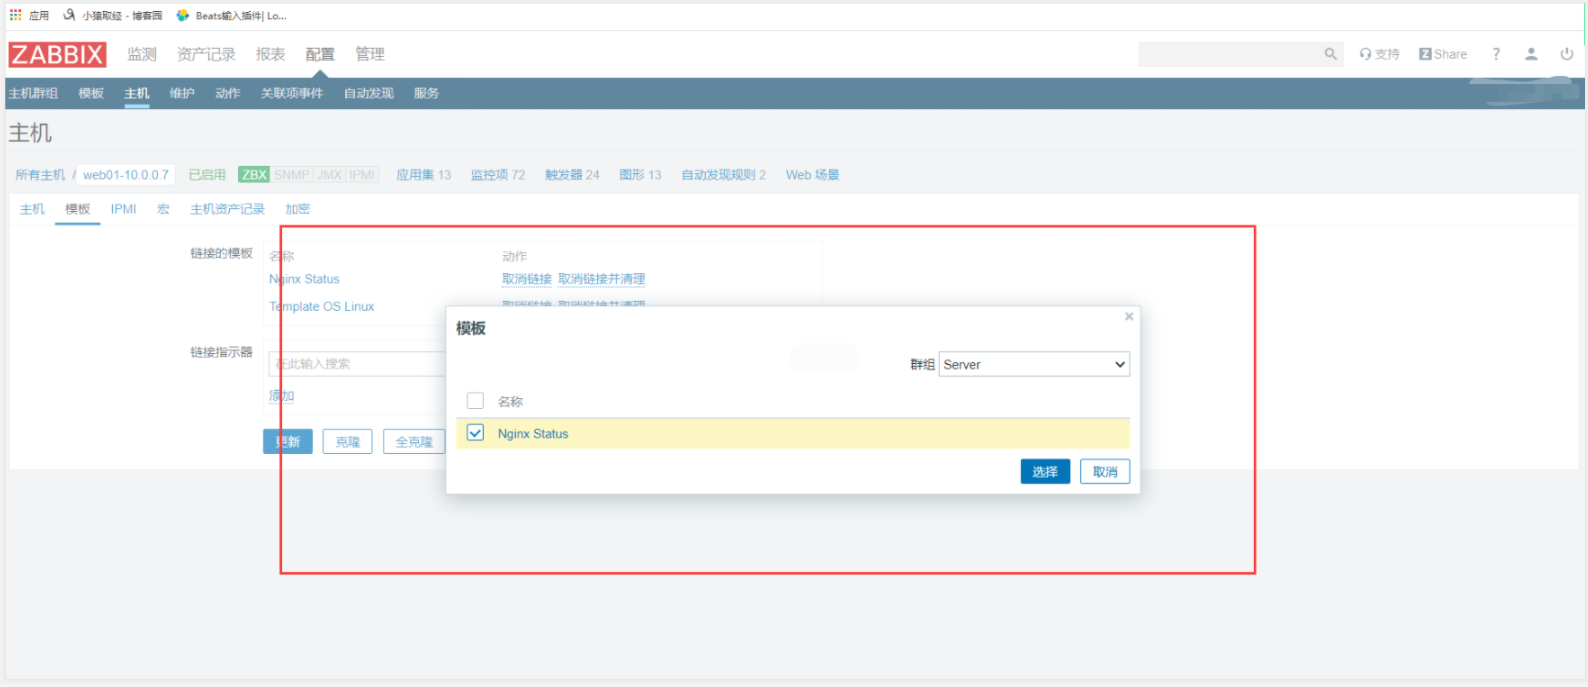

8.添加监控
1.添加80端口监控
2.添加触发器
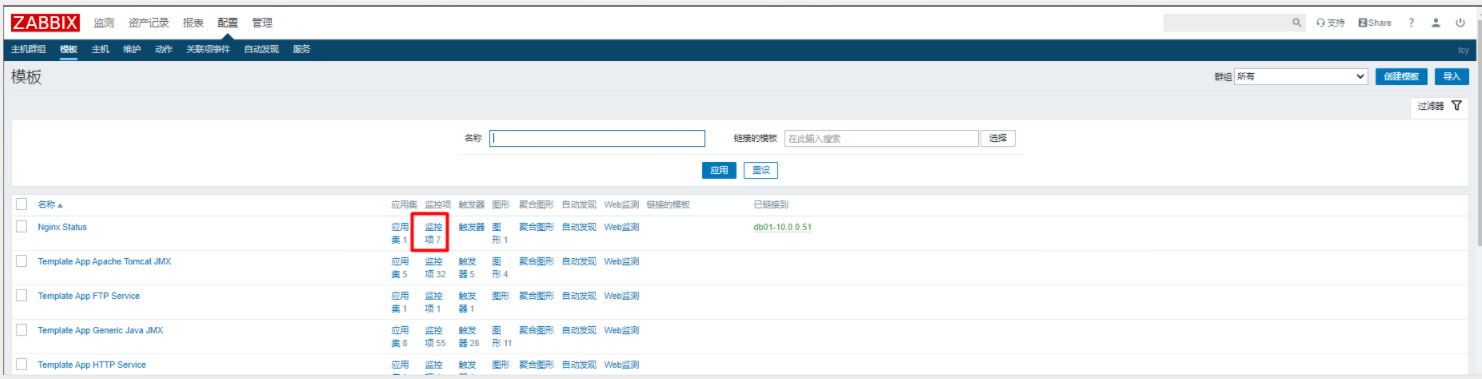
9.针对nginx模板配置nginx监控项


- 监控项创建完成后创建响应触发器

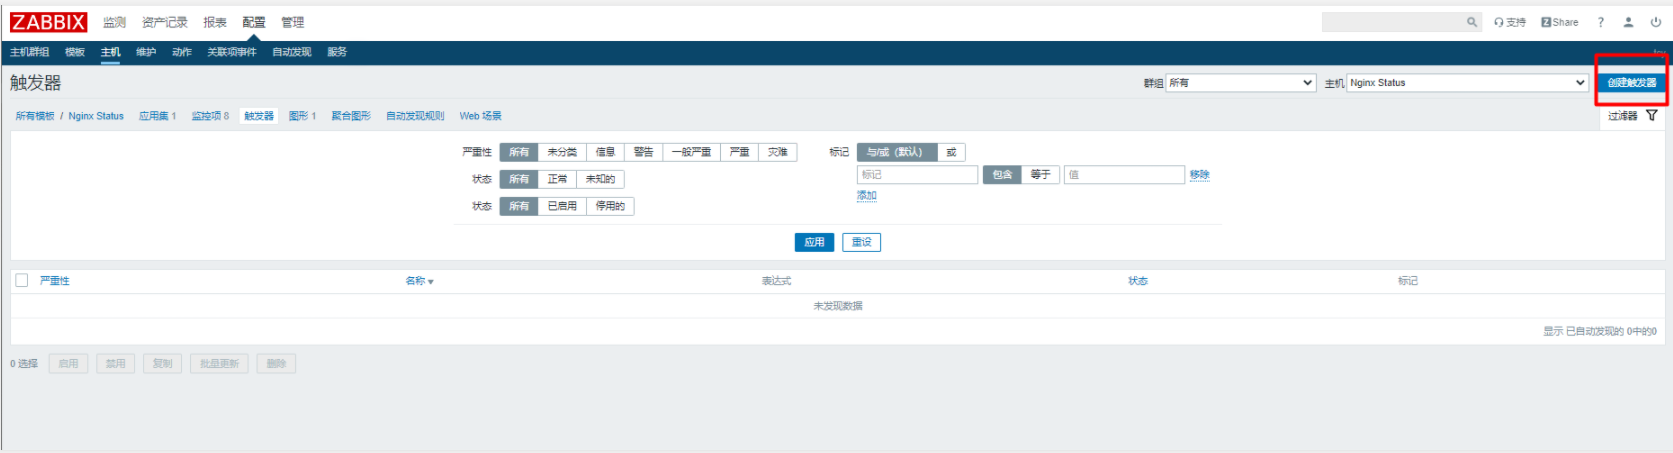
- 添加触发项

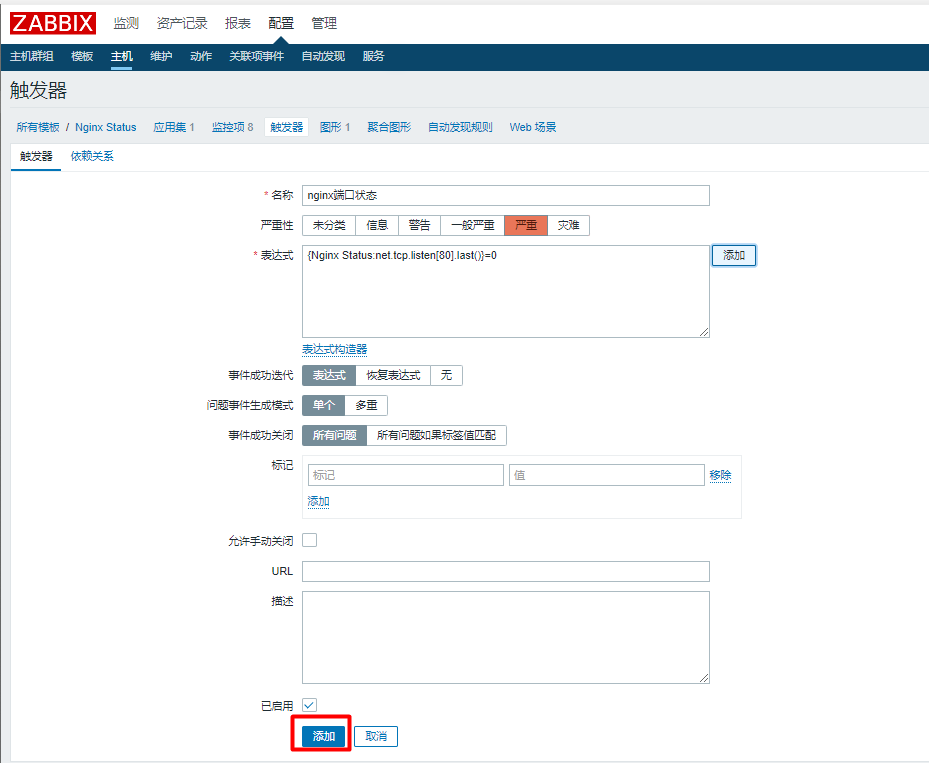
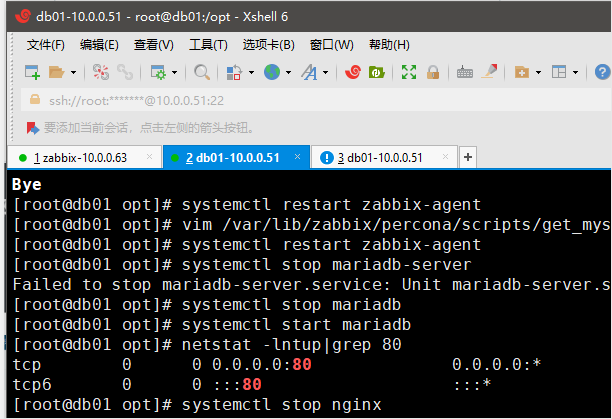
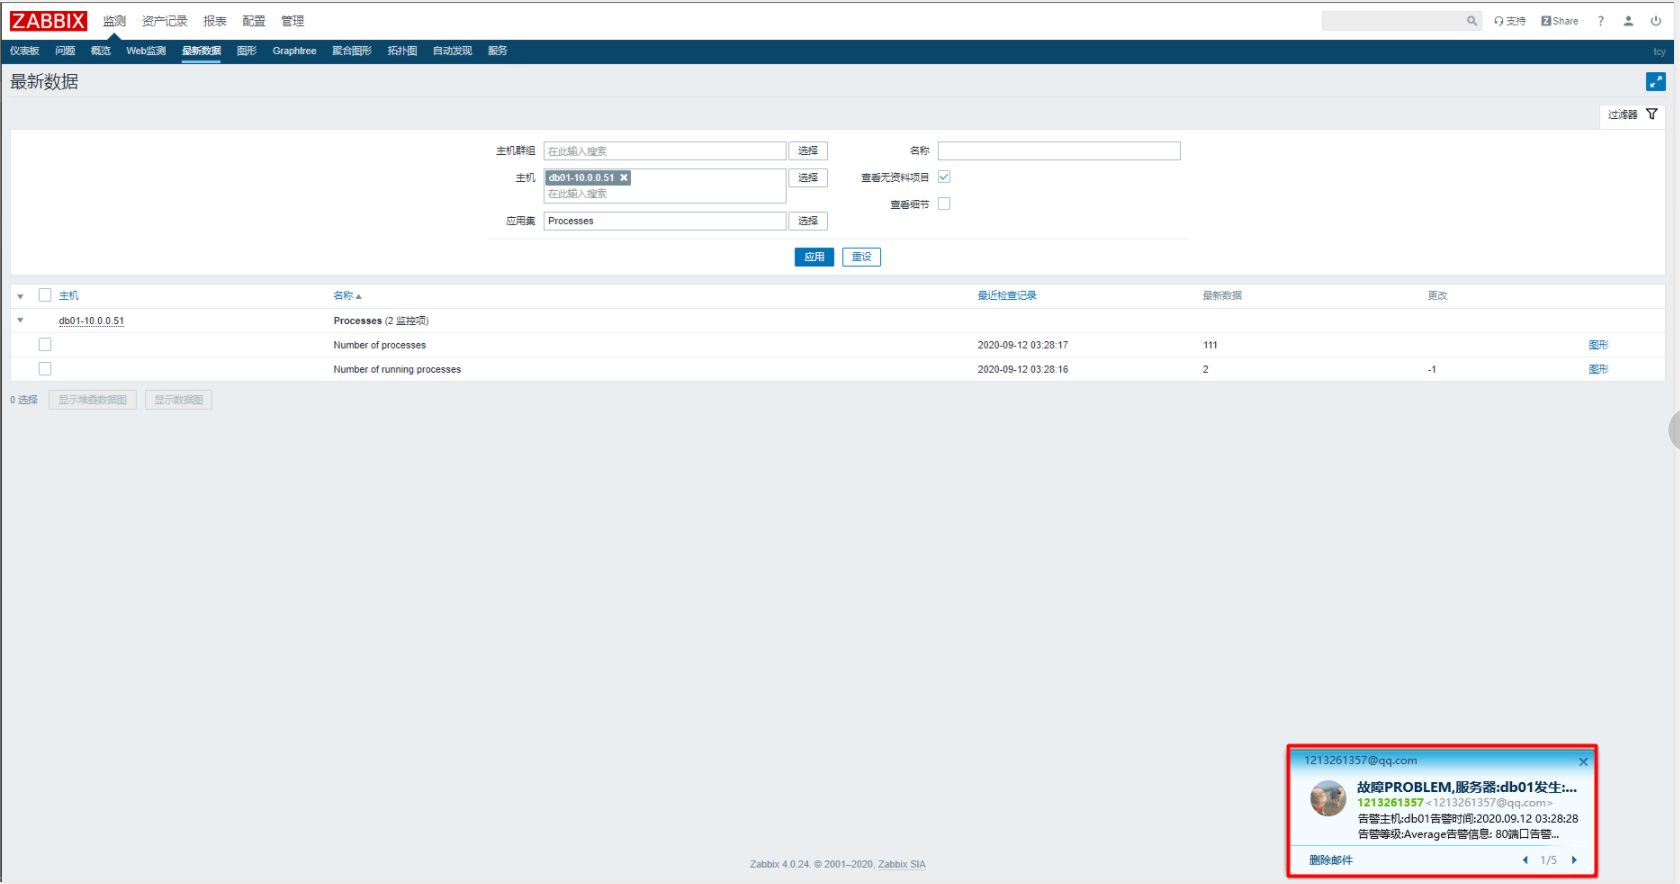
- 测试停止80端口,随机收到邮件报警
三、zabbix监控php
1.安装PHP
[root@web01 ~]# mkdir /package
[root@web01 ~]# cd /package/
[root@web01 package]# rz php72.tar.gz
[root@web01 package]# tar xf php72.tar.gz
[root@web01 package]# yum localinstall -y opt/php/packages/*.rpm
2.配置php状态页
# 将php配置文件中的监控模块开启
[root@web01 package]# vim /etc/php-fpm.d/www.conf
pm.status_path = /php_status
3.启动php
[root@web01 package]# systemctl start php-fpm
4.配置nginx访问php状态页
    server {
        listen       80;
        server_name  localhost;
        root         /usr/share/nginx/html;

        location /nginx_status {
                stub_status;
        }

        location ~* ^/(php_status)$ {
                fastcgi_pass 127.0.0.1:9000;
                fastcgi_param SCRIPT_FILENAME $fastcgi_script_name;
                include fastcgi_params;
        }
    }

[root@web01 package]# systemctl restart nginx
5.php状态页
[root@web01 package]# curl http://127.0.0.1/php_status
pool:                 www								#连接池
process manager:      dynamic							#管理方式
start time:           11/Sep/2020:16:05:50 +0800		  #启动时间
start since:          417								#启动了多久
accepted conn:        9									#连接数
listen queue:         0									#等待的请求队列
max listen queue:     0									#最大等待的请求队列
listen queue len:     128								#等待的请求队列长度
idle processes:       4									#空闲的进程数
active processes:     1									#活跃的进程数
total processes:      5									#总的进程数
max active processes: 1									#最大的活跃的进程数
max children reached: 0									#
slow requests:        0									#慢查询
6.上传脚本
[root@web01 scripts]# rz php_status.sh

[root@web01 scripts]# chmod +x php_status.sh
7.配置监控项
[root@web01 ~]# vim /etc/zabbix/zabbix_agentd.d/php_status.conf
UserParameter=php_status[*],/bin/bash /scripts/php_status.sh $1

[root@web01 ~]# systemctl restart zabbix-agent.service
8.验证监控项
[root@web01 scripts]# zabbix_agentd -t php_status[max_active_processes]
php_status[max_active_processes]              [t|1]

[root@zabbix plugins]# zabbix_get -s 172.16.1.7 -k php_status[slow_requests]
0
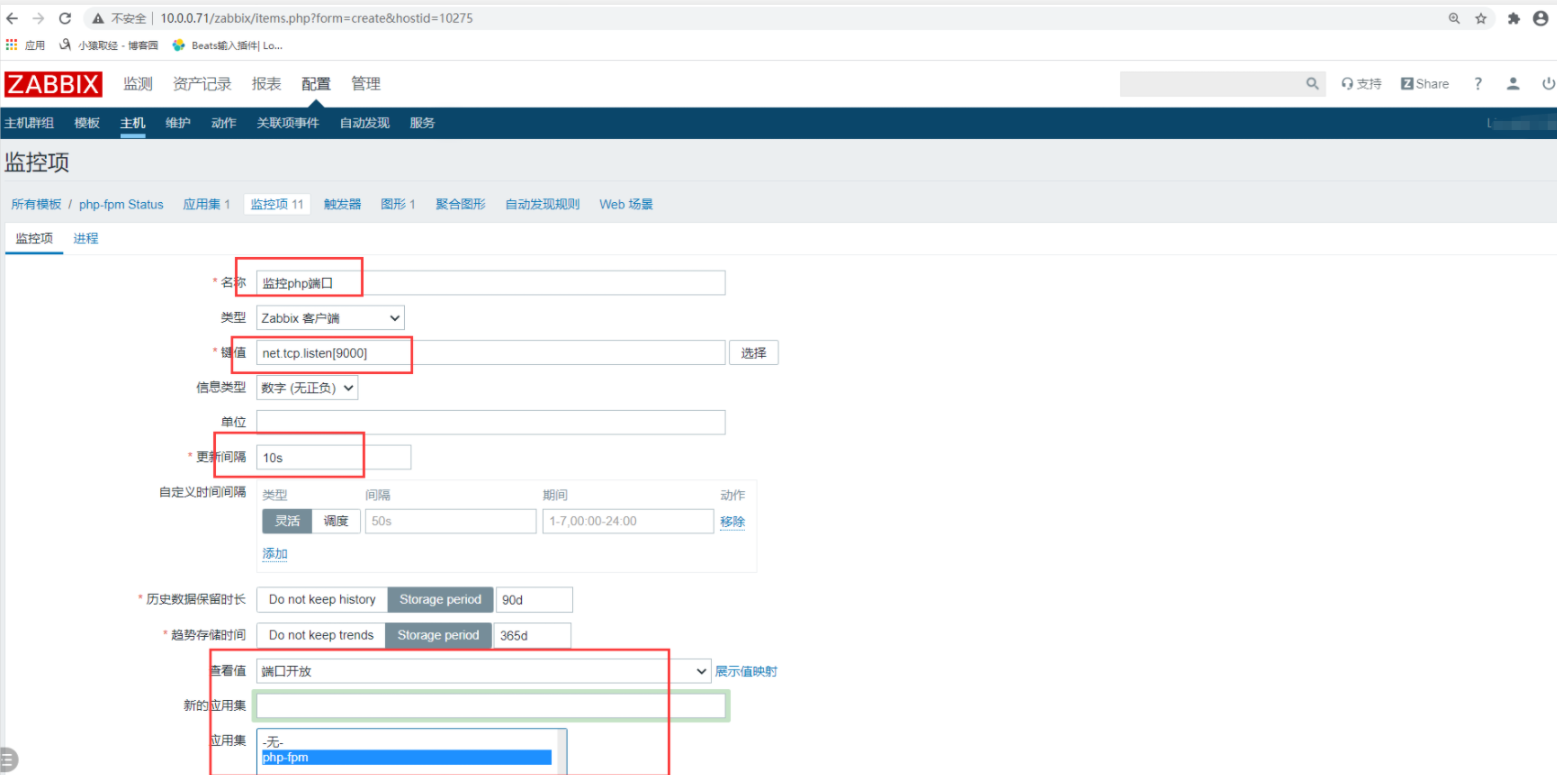
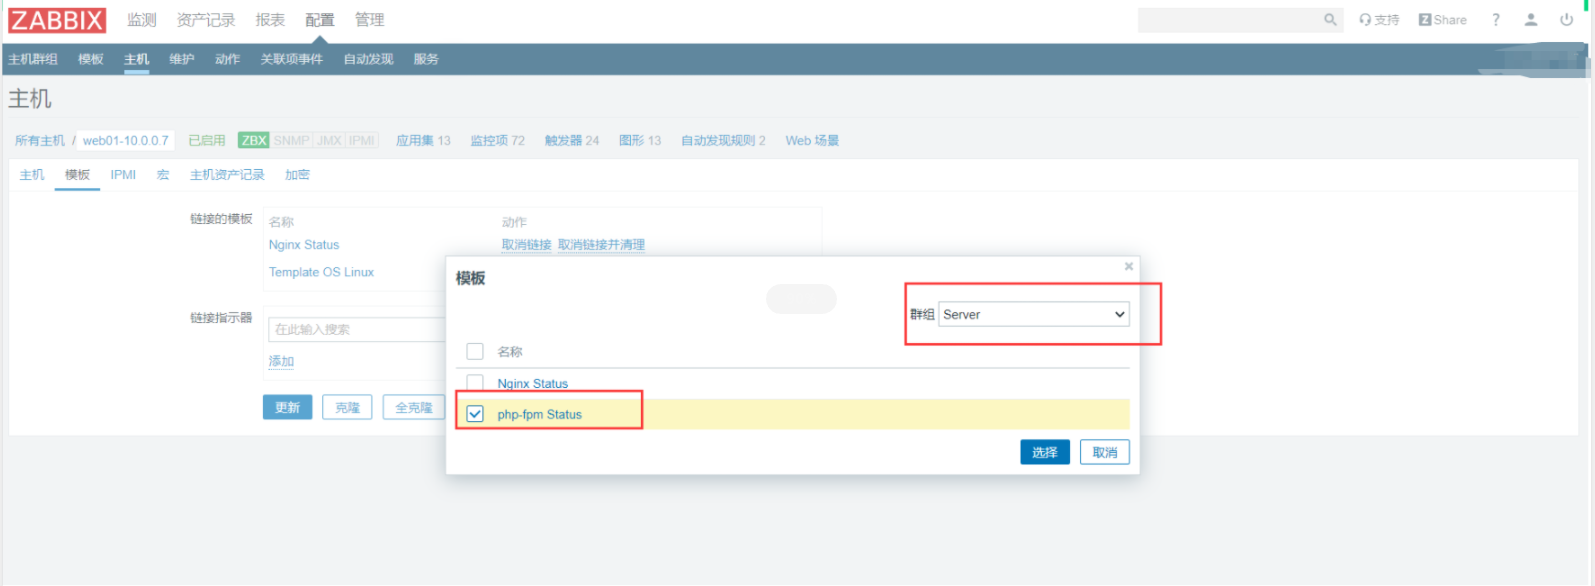
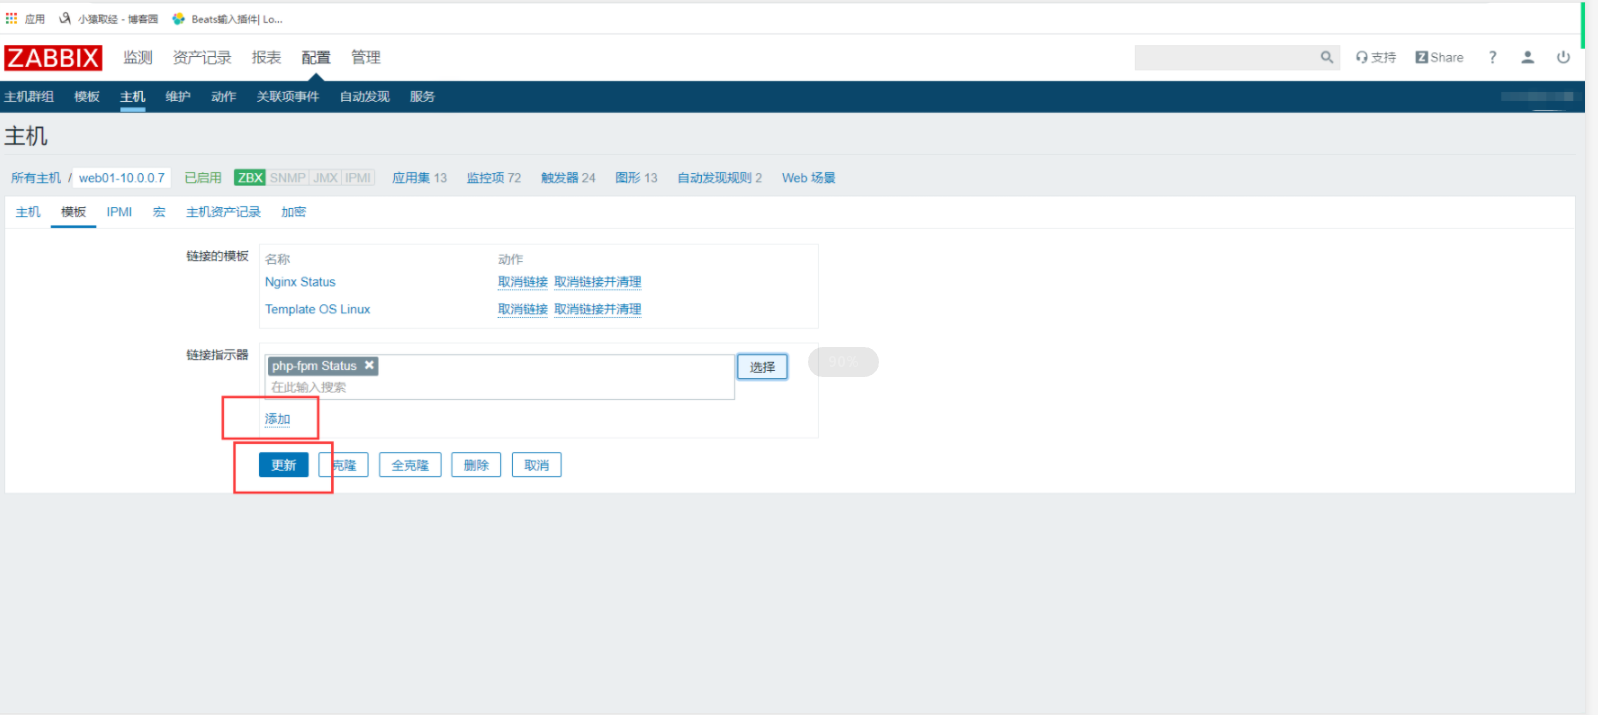
9.添加监控项
添加模板
10.添加监控
1.php端口的监控
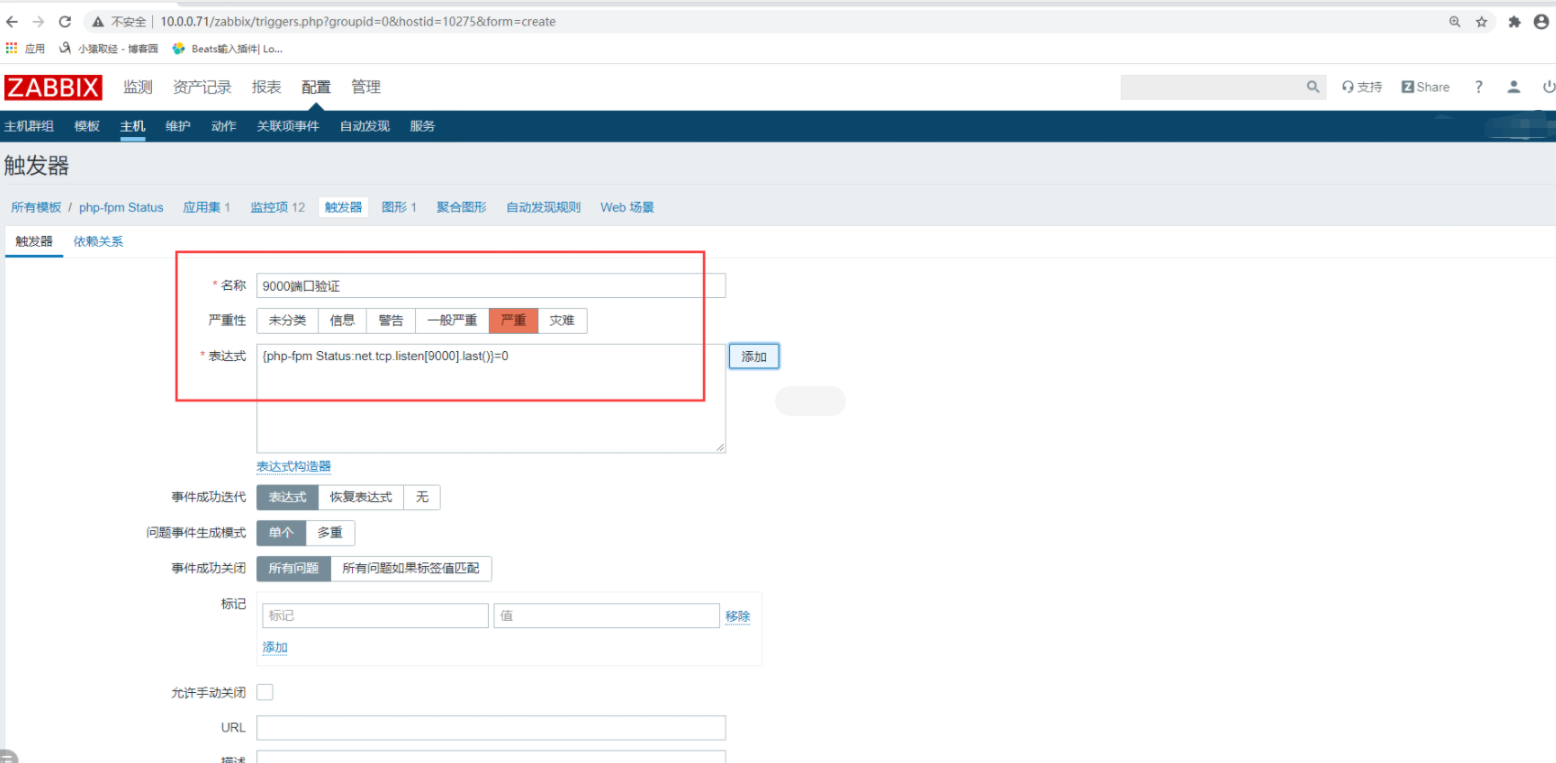
2.添加触发器
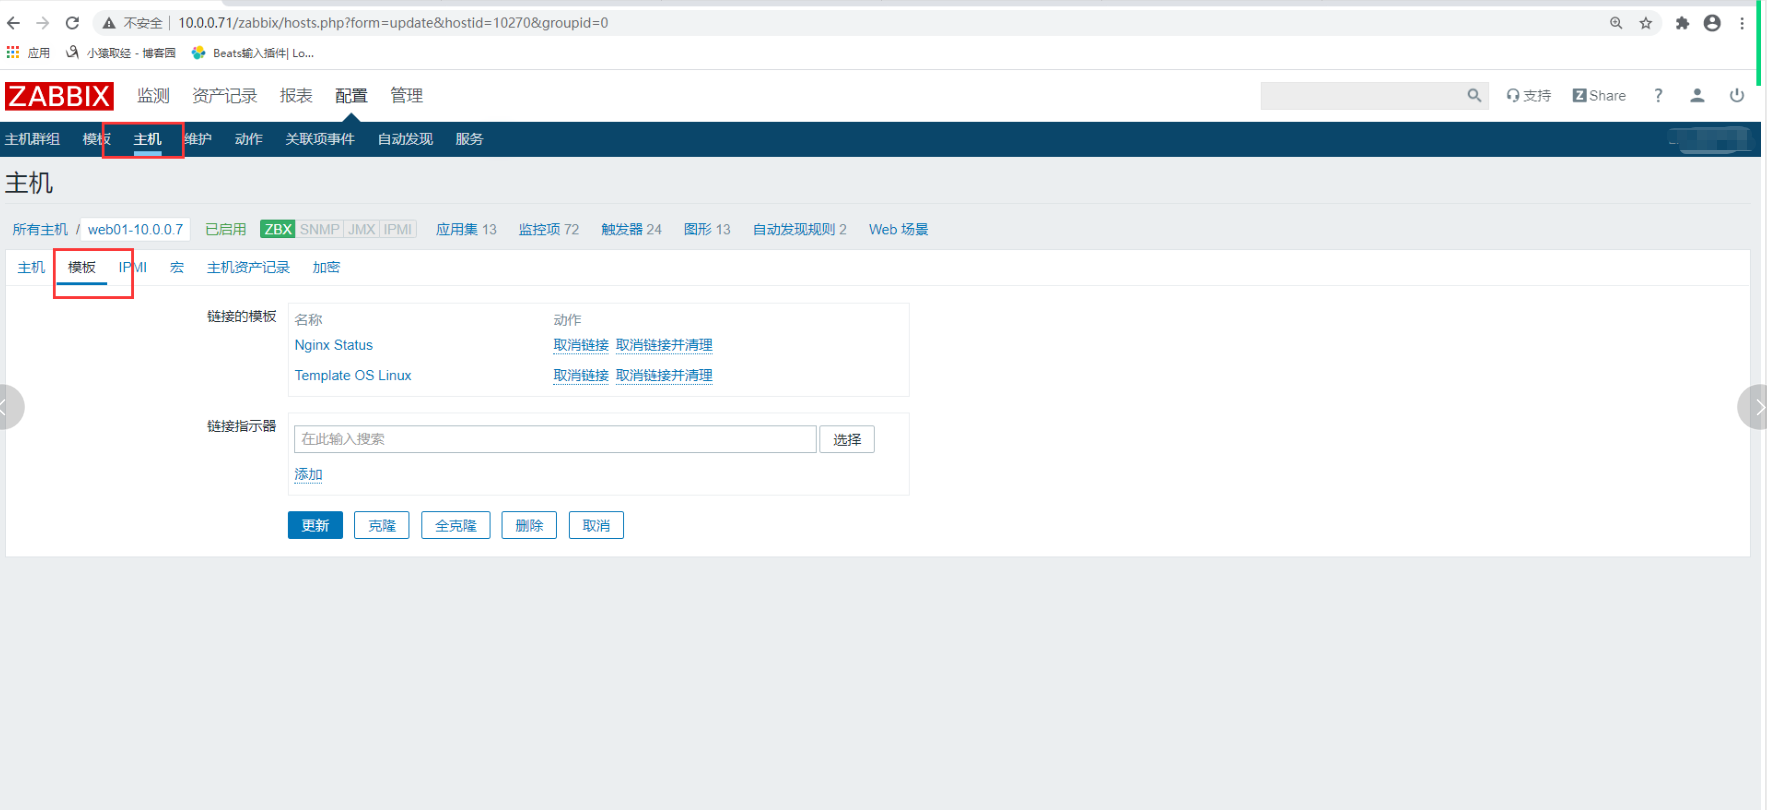
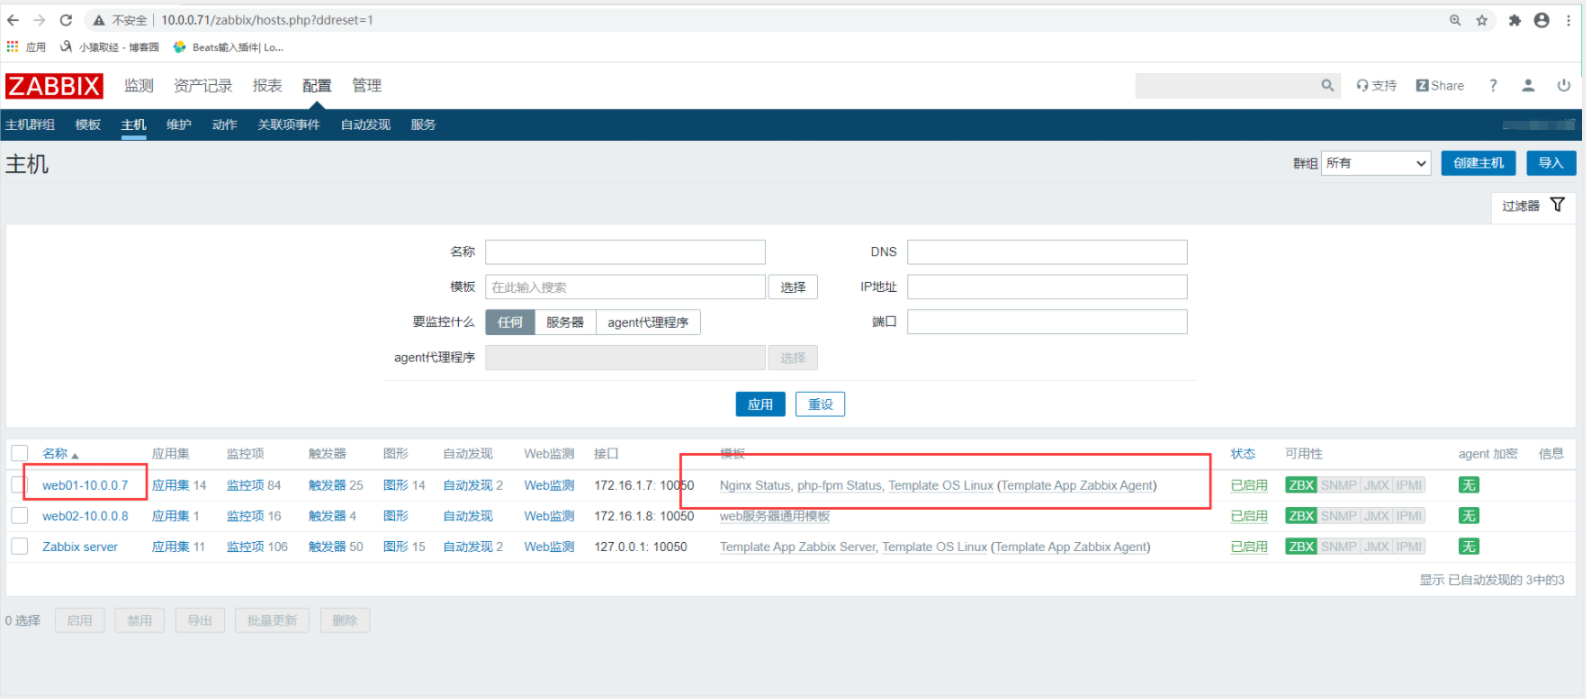
11.主机添加模板
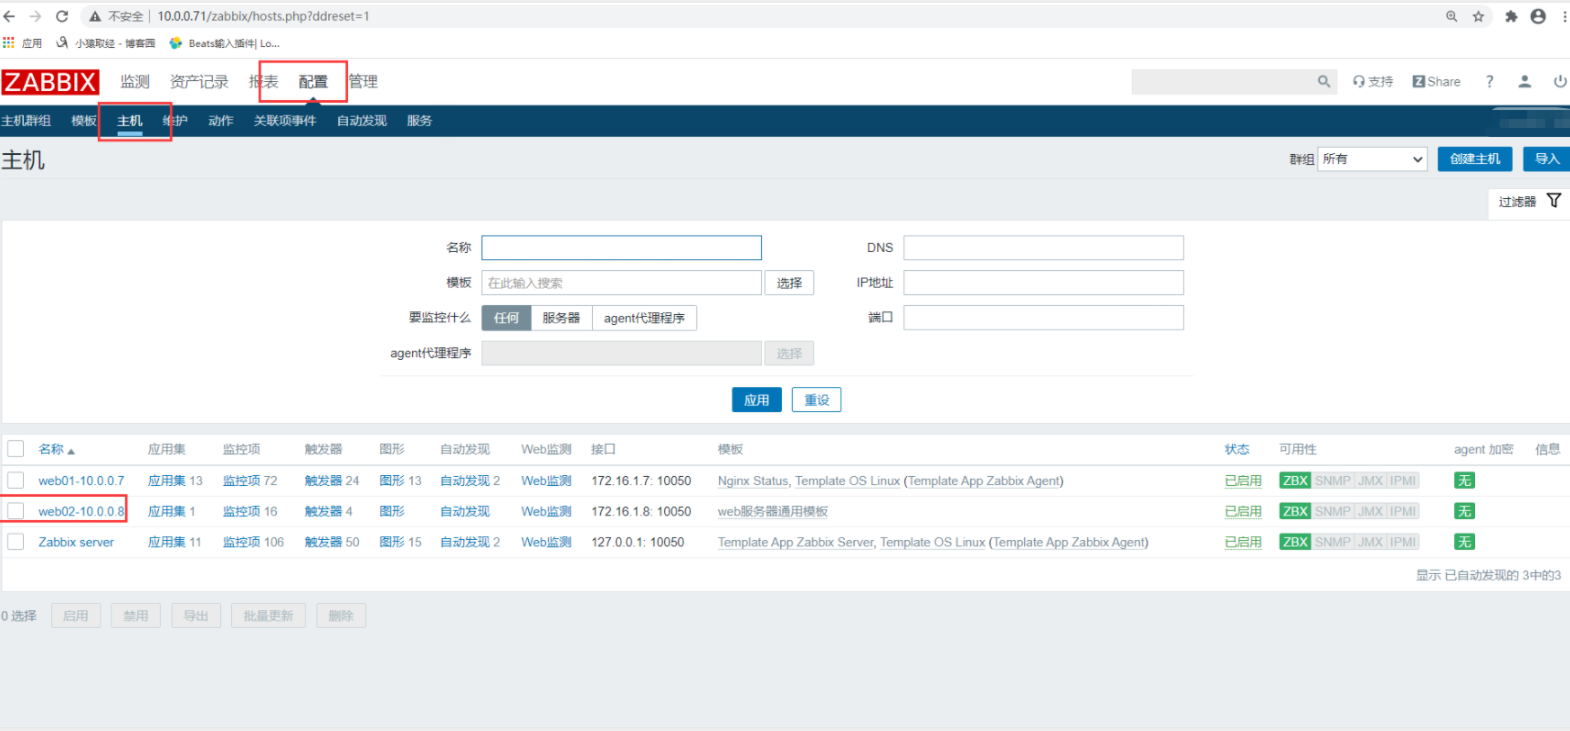

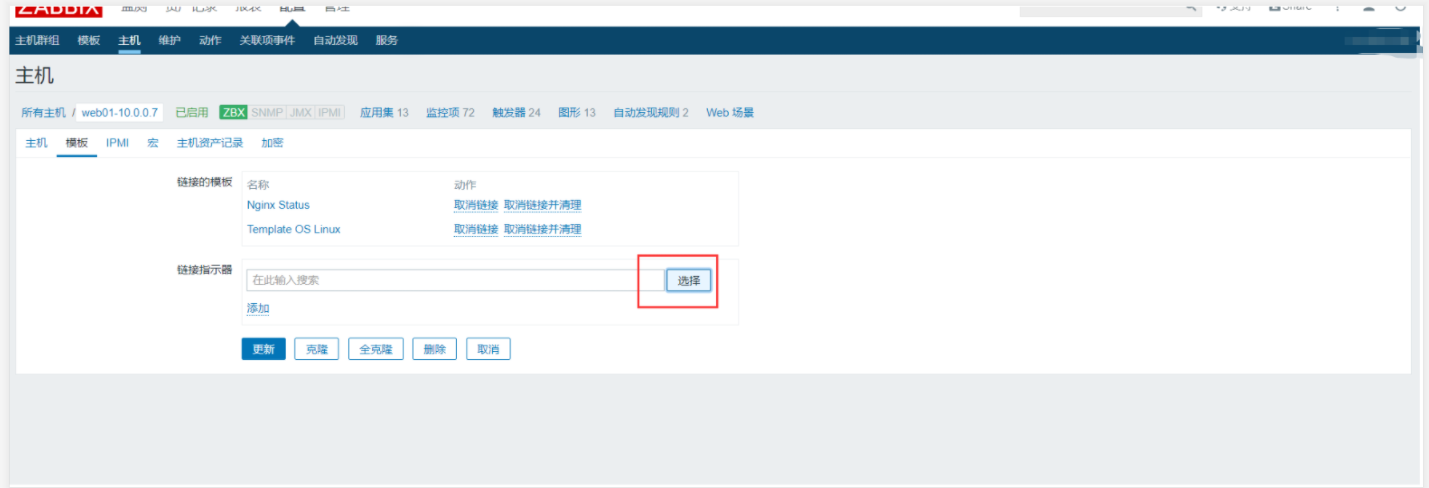
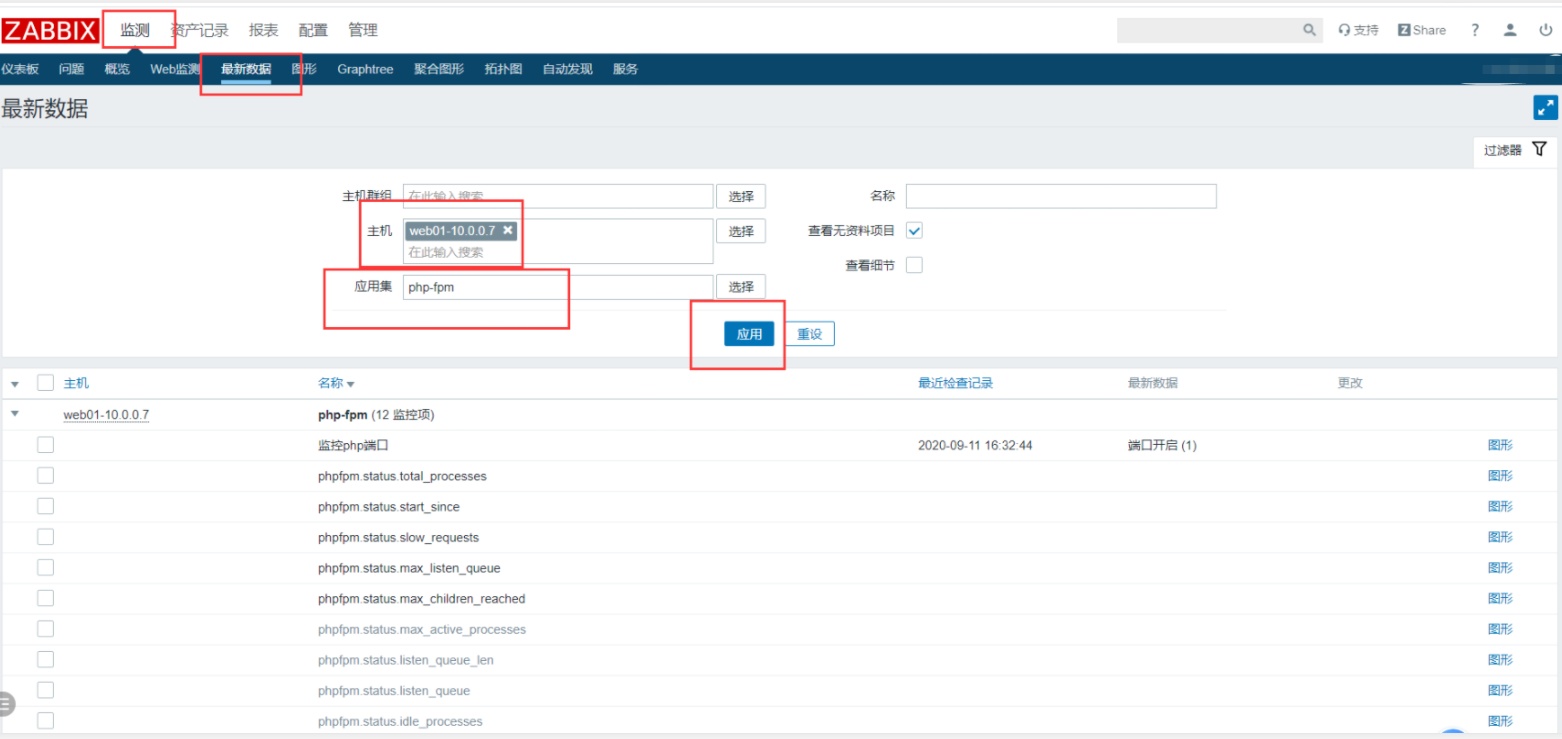
12.查看监控项
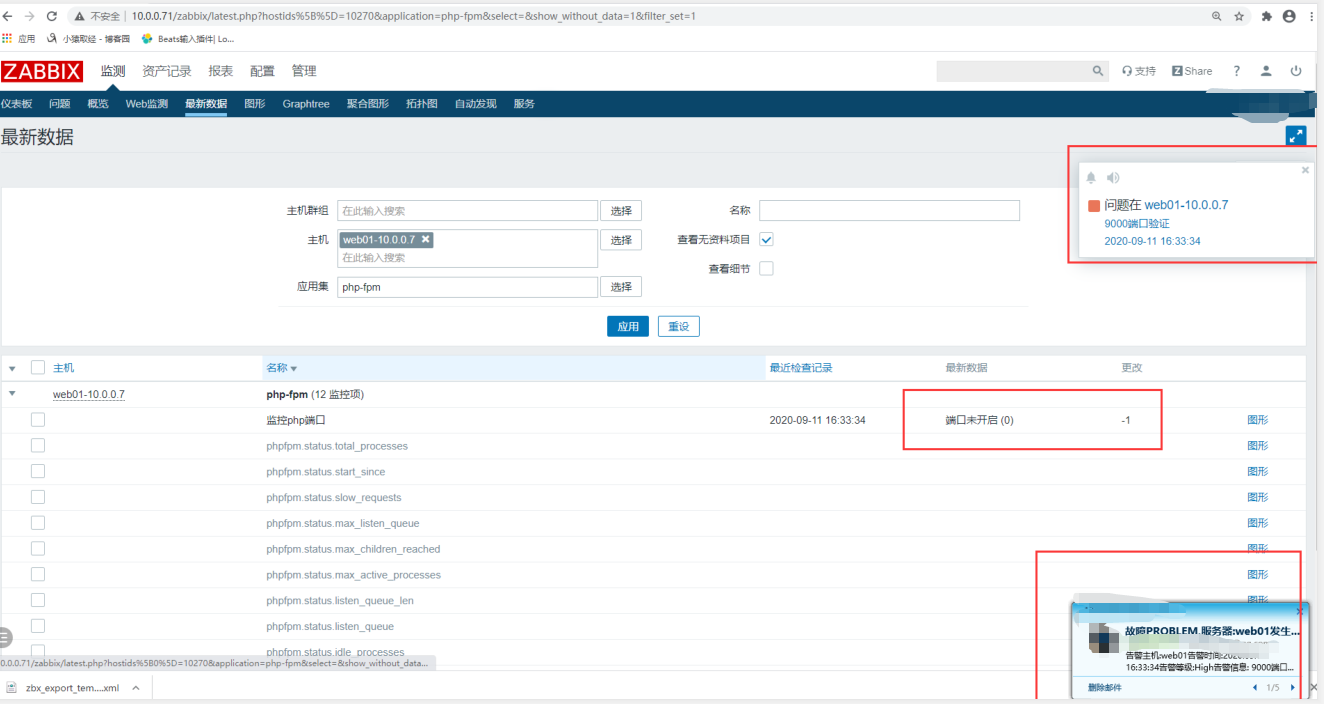
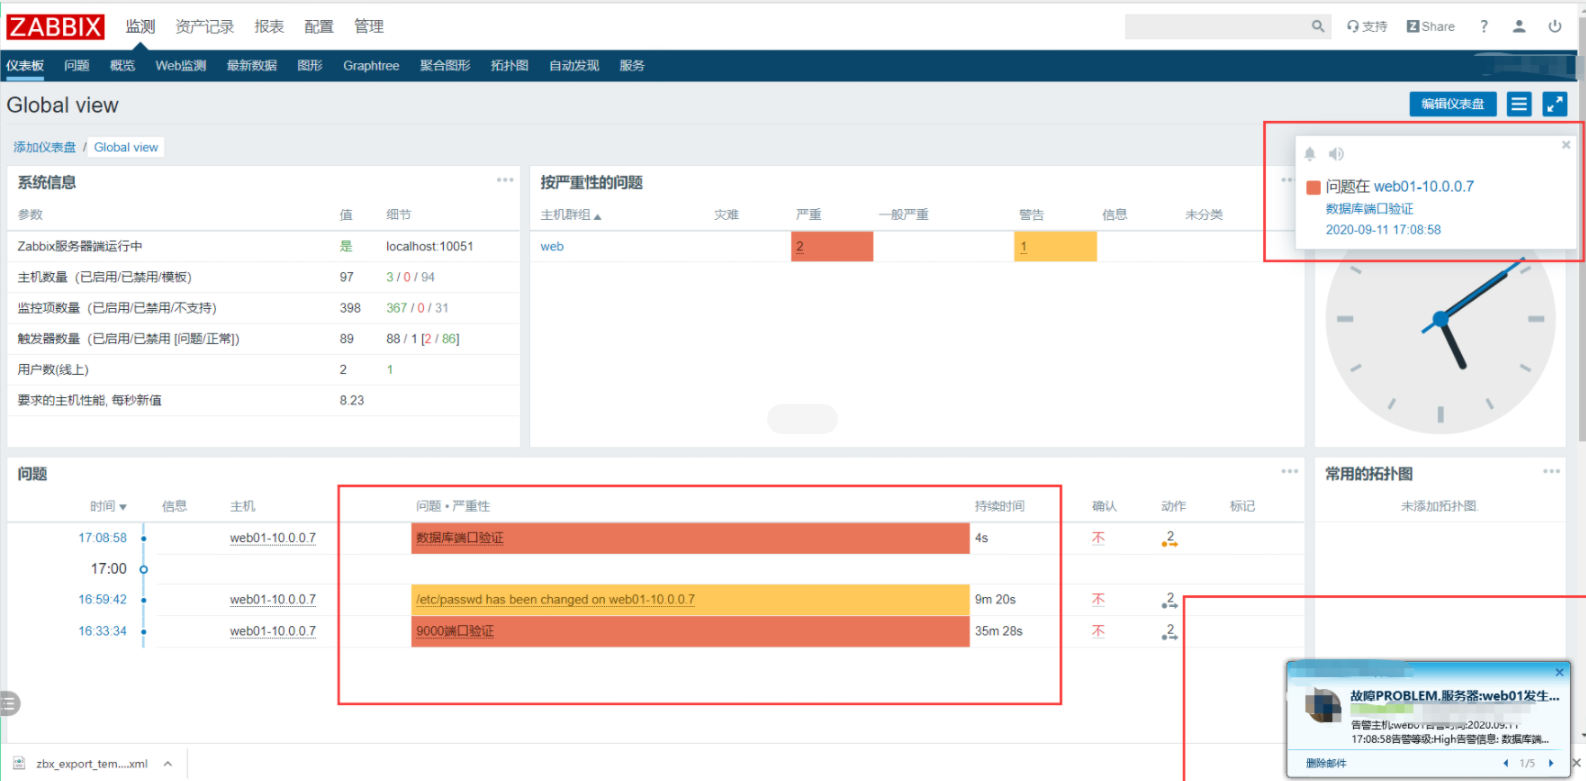
13.告警检测
四、zabbix监控mysql
如果想监控mysql,需要安装 percona monitor plugins 插件
1.安装数据库
[root@web01 ~]# yum install -y mariadb-server
2.启动
[root@web01 ~]# systemctl start mariadb
3.创建用户
MariaDB [(none)]> grant all on *.* to zabbix@'localhost' identified by '123';
Query OK, 0 rows affected (0.00 sec)
4.安装percona
[root@web01 ~]# yum install -y http://www.percona.com/downloads/percona-release/redhat/0.1-3/percona-release-0.1-3.noarch.rpm

#安装插件
[root@web01 ~]# yum install -y percona-zabbix-templates
5.查看安装的内容
[root@web01 ~]# tree /var/lib/zabbix/percona/
/var/lib/zabbix/percona/
├── scripts
│   ├── get_mysql_stats_wrapper.sh
│   └── ss_get_mysql_stats.php
└── templates
    ├── userparameter_percona_mysql.conf
    └── zabbix_agent_template_percona_mysql_server_ht_2.0.9-sver1.1.8.xml

2 directories, 4 files
[root@web01 ~]#
6.配置监控项
[root@web01 ~]# cp /var/lib/zabbix/percona/templates/userparameter_percona_mysql.conf /etc/zabbix/zabbix_agentd.d/

[root@web01 ~]# systemctl restart zabbix-agent.service
7.修改连接数据库信息
[root@web01 ~]# vim /var/lib/zabbix/percona/scripts/ss_get_mysql_stats.php
$mysql_user = 'zabbix';
$mysql_pass = '123';
$mysql_port = 3306;
8.验证监控项
[root@web01 ~]# zabbix_agentd -t MySQL.running-slave
MySQL.running-slave                           [t|0]

#服务端验证,报错
[root@zabbix plugins]# zabbix_get -s 172.16.1.7 -k MySQL.running-slave
ERROR 1045 (28000): Access denied for user 'zabbix'@'localhost' (using password: NO)
0
#因为脚本中没有使用数据库密码和用户
[root@web01 ~]# vim /var/lib/zabbix/percona/scripts/get_mysql_stats_wrapper.sh
	#把 -uzabbix -p123 加进去
    RES=`HOME=~zabbix mysql -uzabbix -p123 -e 'SHOW SLAVE STATUSG' | egrep '(Slave_IO_Running|Slave_SQL_Running):' | awk -F: '{print $2}' | tr '
' ','`
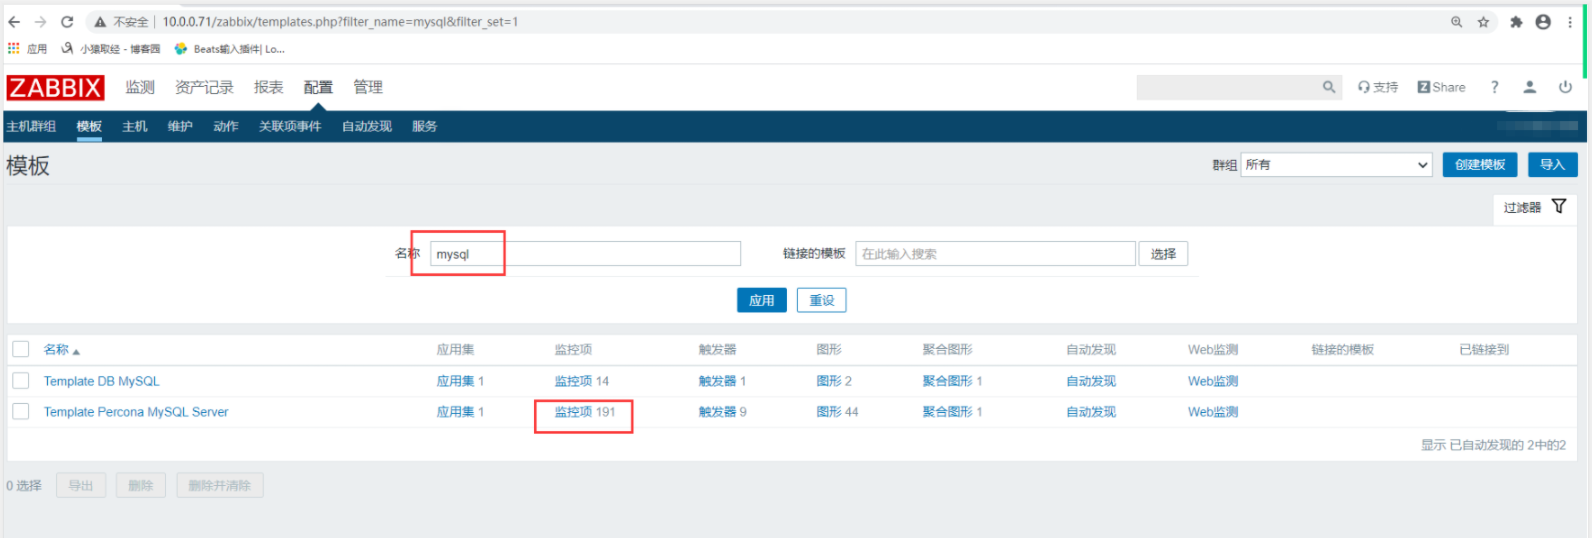
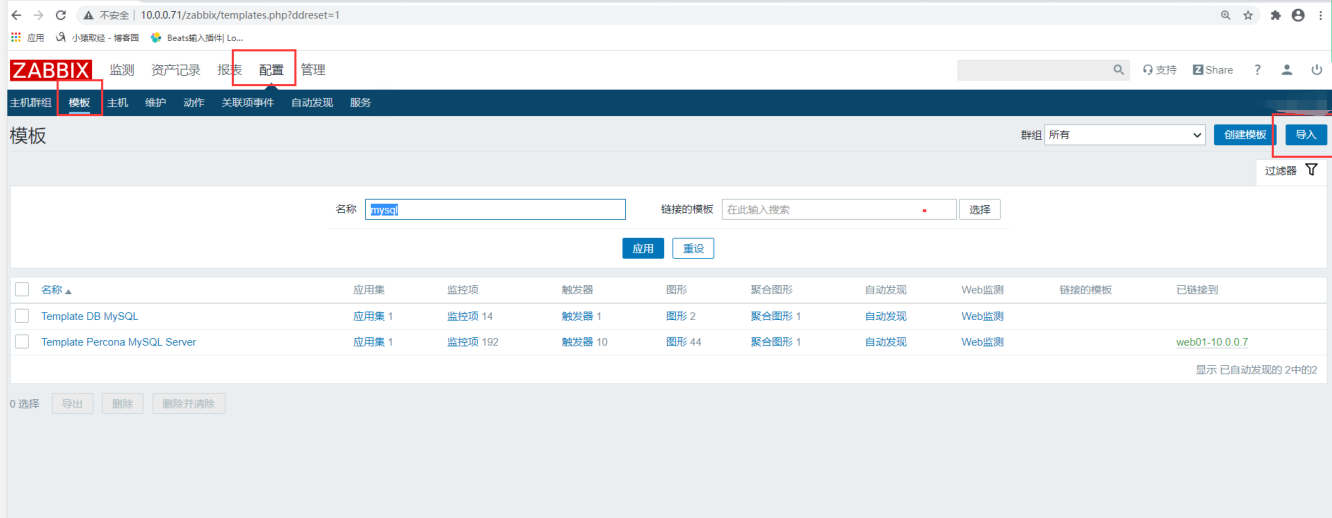
9.导入监控模板
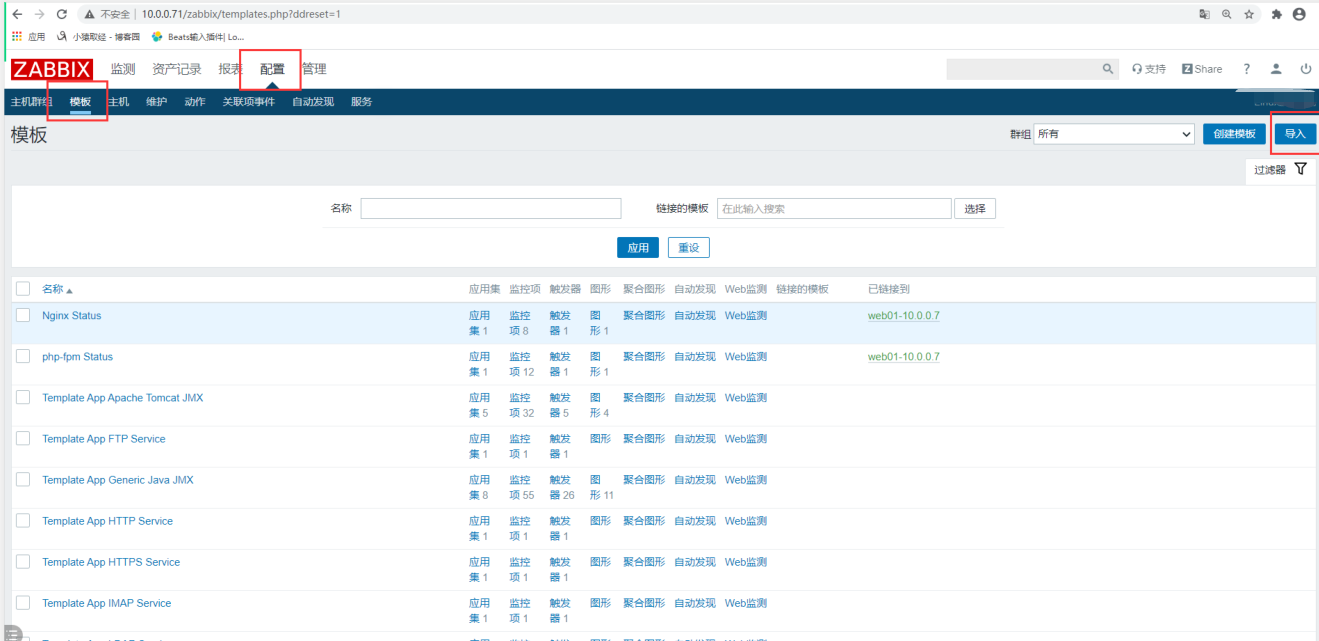
1.下载percona模板
2.导入模板,报错
	模板与zabbix版本不兼容
	解决办法:将模板导入2.0版本的zabbix,在到处,再倒入到4.0版本

3.导入转化过的模板 zbx_percona_mysql_template.xml

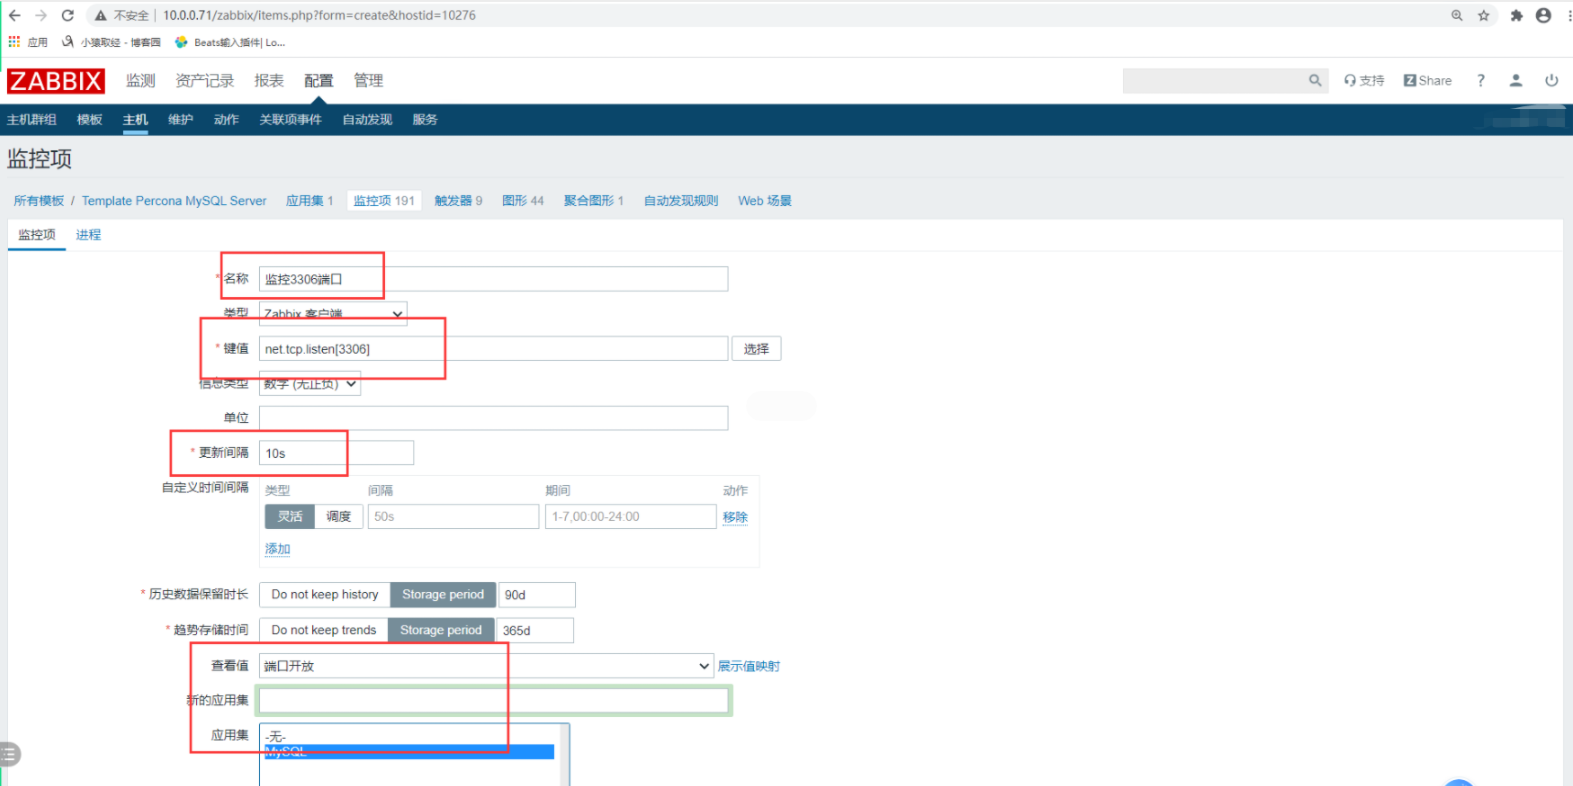
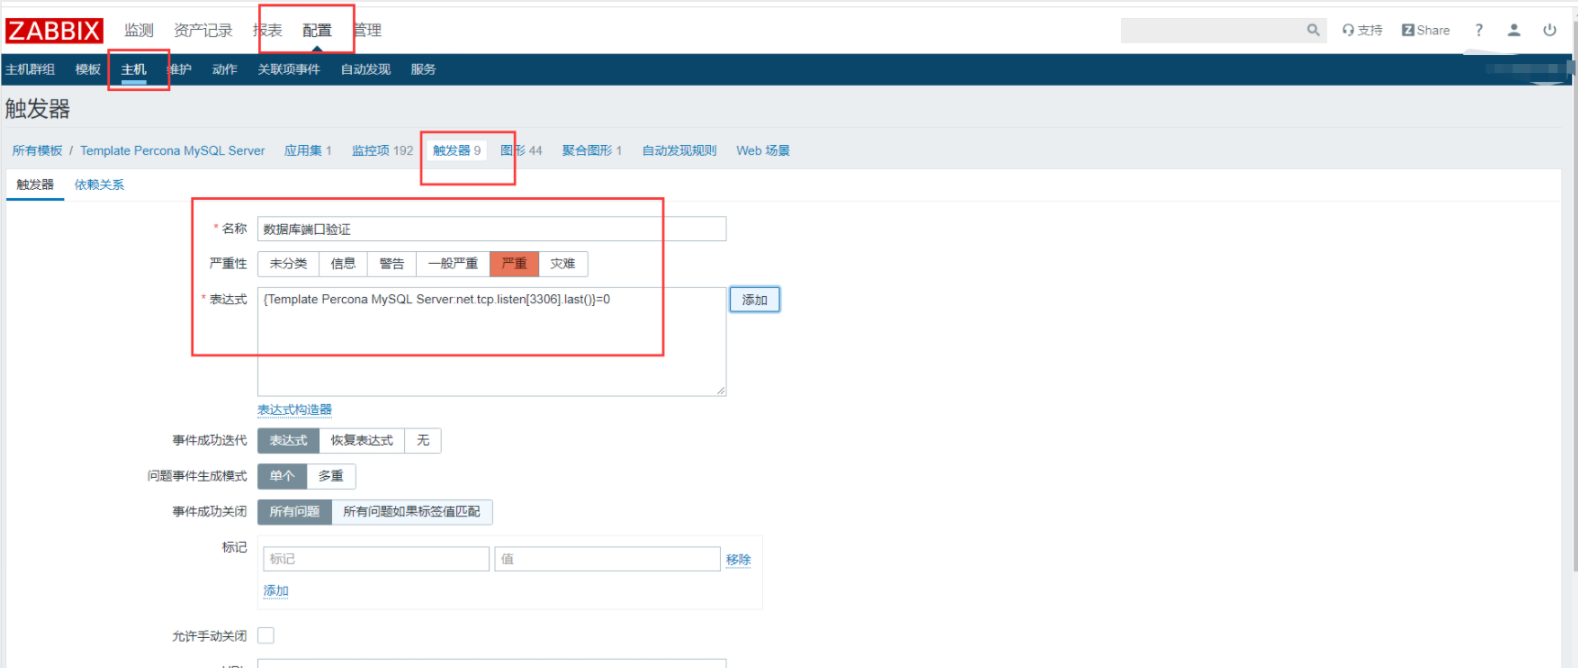
10.添加监控
1.添加端口监控
2.添加触发器
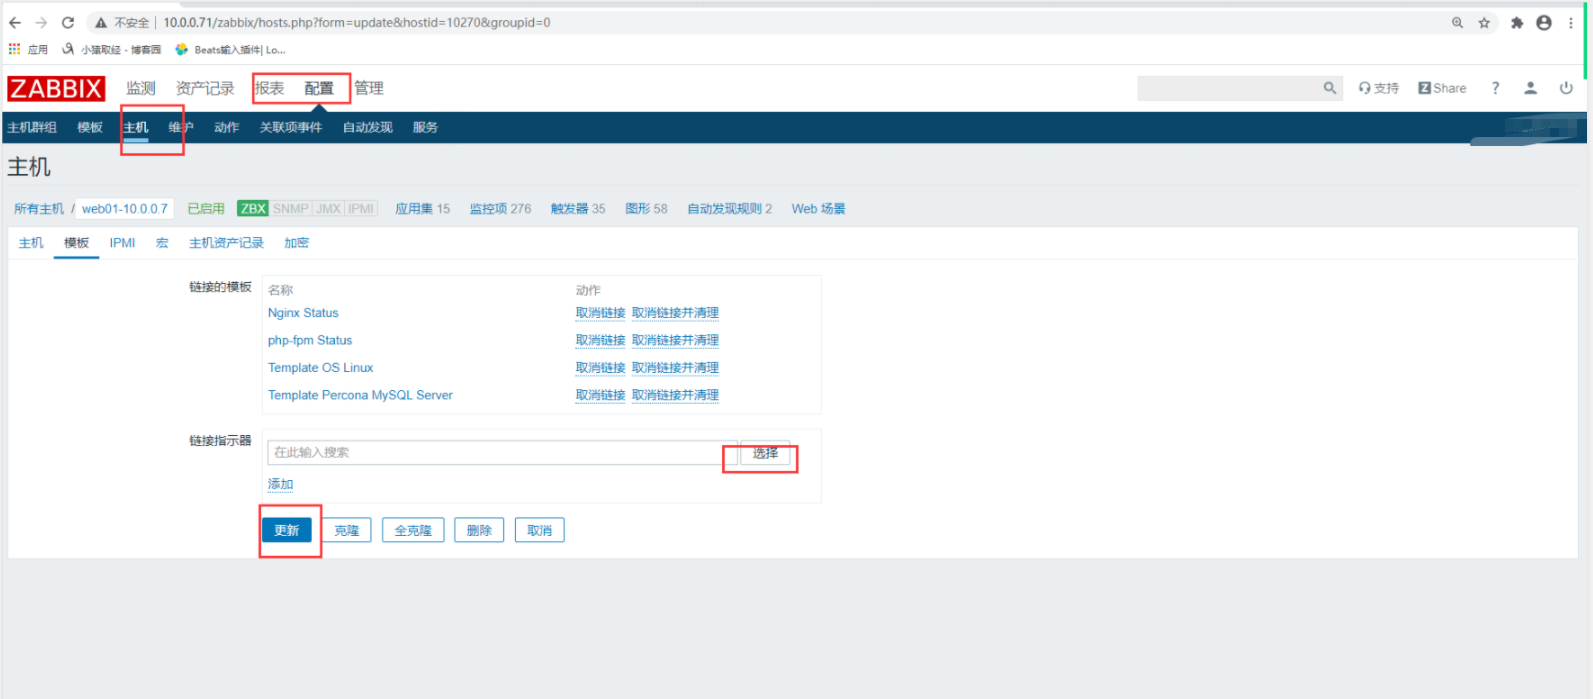
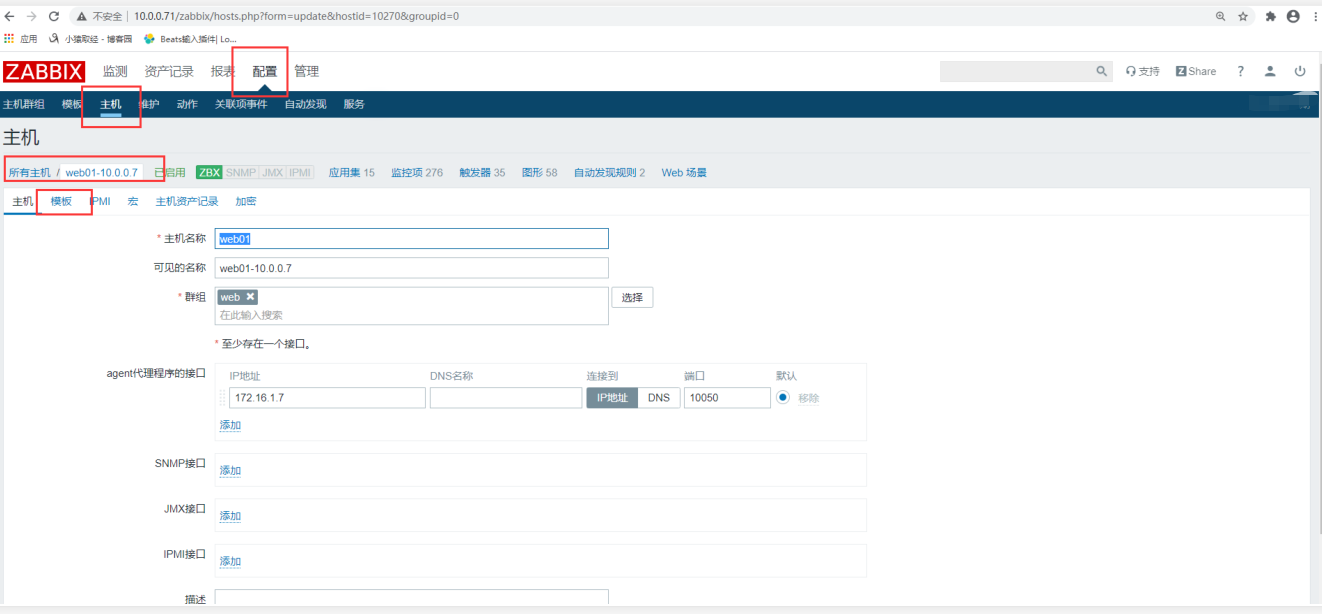
11.找到主机添加模板
12.告警测试

五、zabbix监控redis
1.搭建discuz论坛
#1.配置nginx
[root@web01 ~]# vim /etc/nginx/conf.d/discuz.conf
server {
    listen 80;
    server_name linux.discuz.com;

    location / {
        root /code/upload;
        index index.php;
    }

    location ~* .php$ {
        root /code/upload;
        fastcgi_pass 127.0.0.1:9000;
        fastcgi_param SCRIPT_FILENAME $document_root$fastcgi_script_name;
        include fastcgi_params;
    }
}
[root@web01 ~]# systemctl restart nginx

#2.配置站点
[root@web01 ~]# mkdir /code
[root@web01 ~]# rz Discuz_X3.3_SC_GBK.zip
[root@web01 ~]# unzip Discuz_X3.3_SC_GBK.zip -d /code/

#3.配置hosts
10.0.0.7 linux.discuz.com

#4.统一用户
[root@web01 ~]# vim /etc/php-fpm.d/www.conf
[root@web01 ~]# vim /etc/nginx/nginx.conf
[root@web01 ~]# groupadd www -g 666
[root@web01 ~]# useradd www -u 666 -g 666
[root@web01 ~]# systemctl restart nginx
[root@web01 ~]# systemctl restart php-fpm
[root@web01 ~]# chown -R www.www /code/
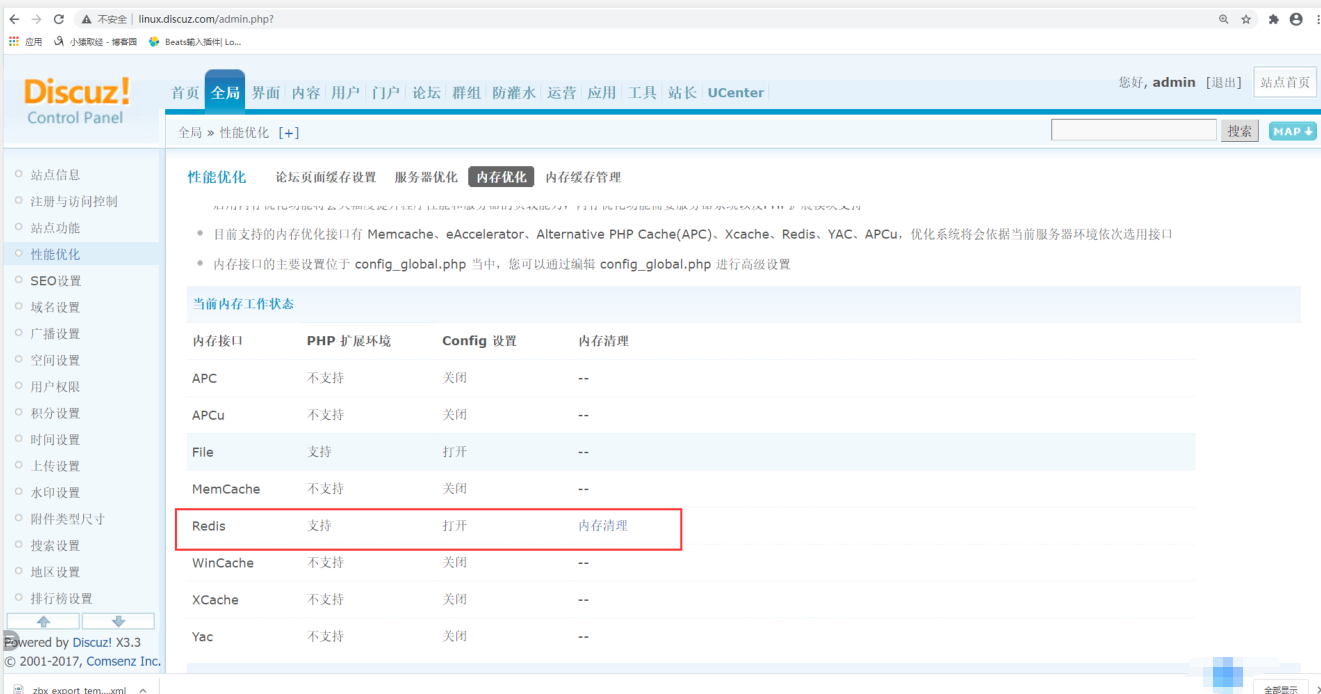
2.安装redis
[root@web01 ~]# yum install -y redis
[root@web01 ~]# vim /etc/redis.conf
requirepass 123
[root@web01 ~]# systemctl start redis
3.配置discuz连接redis
[root@web01 ~]# vim /code/upload/config/config_global.php
// --------------------------  CONFIG MEMORY  --------------------------- //
$_config['memory']['prefix'] = 'kRZWnw_';
$_config['memory']['redis']['server'] = '127.0.0.1';
$_config['memory']['redis']['port'] = 6379;
$_config['memory']['redis']['pconnect'] = 1;
$_config['memory']['redis']['timeout'] = '0';
$_config['memory']['redis']['requirepass'] = '123';
4.redis状态监控
[root@web01 ~]# redis-cli info
5.上传脚本
# 通过脚本文件对redis状态进行调用
[root@web01 scripts]# rz redis_status_.sh
[root@web01 scripts]# chmod +x redis_status_.sh
6.配置监控项
# 书写zabbix客户端自定义监控文件,调用脚本文件
[root@web01 scripts]# vim /etc/zabbix/zabbix_agentd.d/redis_status.conf
UserParameter=redis_status[*],/bin/bash /scripts/redis_status.sh $1

[root@web01 scripts]# systemctl restart zabbix-agent.service
7.检查监控项
[root@web01 scripts]# zabbix_agentd -t redis_status[used_memory]
redis_status[used_memory]

[root@zabbix plugins]# zabbix_get -s 172.16.1.7 -k redis_status[used_memory]
/scripts/redis_status.sh: line 7: /tmp/redis_6379.tmp: Permission denied
924680
#权限不足,将文件删除即可
[root@web01 scripts]# rm -rf /tmp/redis_6379.tmp
8.导入模板

9.给模板添加监控
1.添加端口监控项
2.添加触发器


10.主机关联模板

11.告警检测
[root@web01 scripts]# systemctl stop redis
