目录
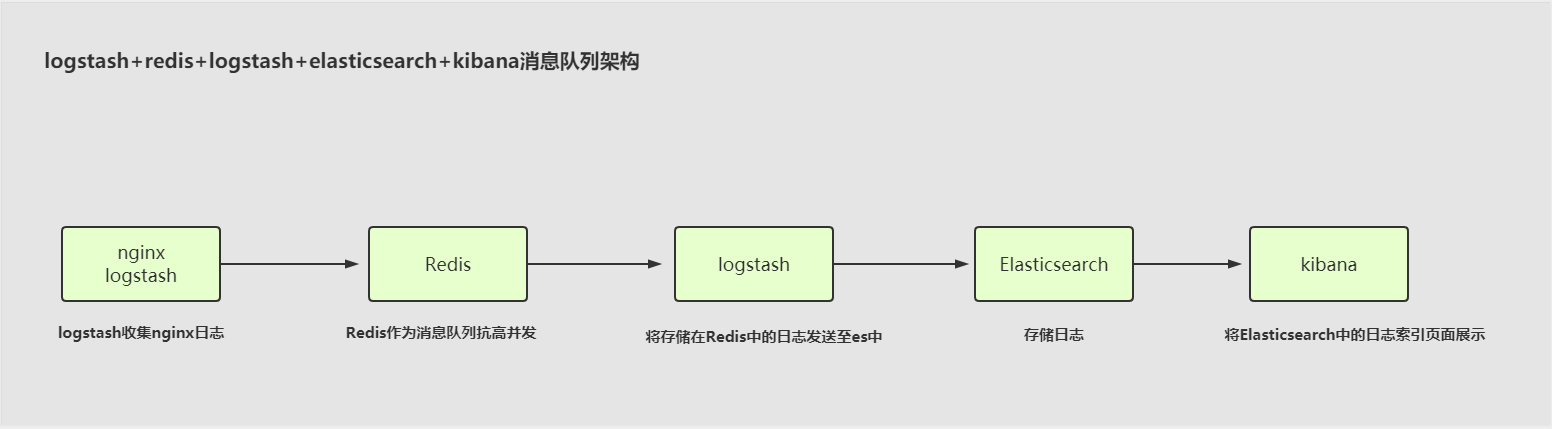
一、Logstash将数据收集到Redis
0.建议
· 不要将es和redis存放在一台服务器中,两者都消耗内存,防止内存不足,下列操作仅供案例参考。
1.准备环境
| 主机 | IP | 部署的服务 |
|---|---|---|
| web01 | 172.16.1.7 | nginx,tomcat,logstash |
| db01 | 172.16.1.51 | es,kibana,redis |
| db02 | 172.16.1.52 | es,logstash |
| db03 | 172.16.1.53 | es |
2.安装redis、ES、kibana、logstash
# 注意:
这里的安装操作不做演示,可以参考之前的博文。redis的启动建议使用自定义目录启动,否则配置文件中有些地方需要修改。
3.配置收集Nginx日志到redis
[root@web01 ~]# vim /etc/logstash/conf.d/nginx_to_redis.conf
input {
  file {
    path => "/var/log/nginx/access.log"
    start_position => "beginning"
    codec => "json"
  }
}
output {
  redis {
    host => "172.16.1.51"
    port => "6379"
    data_type => "list"
    db => "0"
    key => "nginx_log"
  }
}
4.收集Nginx和tomcat日志到redis
# 将nginx和tomcat的日志发送至redis中。需要以list列表形式存储。
[root@web01 ~]# vim /etc/logstash/conf.d/more_to_redis.conf
input {
  file {
    type => "nginx_log"
    path => "/var/log/nginx/access.log"
    start_position => "beginning"
    codec => "json"
  }
  file {
    type => "tomcat_log"
    path => "/usr/local/tomcat/logs/tomcat_access_json.*.log"
    start_position => "beginning"
    codec => "json"
  }
}
output {
  if [type] == "nginx_log" {
    redis {
      host => "172.16.1.51"
      port => "6379"
      data_type => "list"
      db => "0"
      key => "nginx_log"
    }
  }
  if [type] == "tomcat_log" {
    redis {
      host => "172.16.1.51"
      port => "6379"
      data_type => "list"
      db => "1"
      key => "tomcat_log"
    }
  }
}

#验证:访问Nginx和tomcat页面,查看redis里面有没有key
127.0.0.1:6379> LLEN nginx_log
(integer) 1
127.0.0.1:6379> LLEN nginx_log
(integer) 888
127.0.0.1:6379> LRANGE nginx_log 0 -1
5.配置将redis取出,写入ES
# 通过db02中安装的logstash将db01的redis中的数据发送到db01的es中。
[root@db02 ~]# yum localinstall -y logstash-6.6.0.rpm
[root@db02 ~]# vim /etc/logstash/conf.d/redis_to_es.conf
input {
  redis {
    host => "172.16.1.51"
    port => "6379"
    db => "0"
    data_type => "list"
    key => "nginx_log"
  }
  redis {
    host => "172.16.1.51"
    port => "6379"
    db => "1"
    data_type => "list"
    key => "tomcat_log"
  }
}
output {
  if [type] == "nginx_log" {
    elasticsearch {
      hosts => ["10.0.0.51:9200"]
      index => "nginx_log_%{+YYYY-MM-dd}"
    }
  }
  if [type] == "tomcat_log" {
    elasticsearch {
      hosts => ["10.0.0.51:9200"]
      index => "tomcat_log_%{+YYYY-MM-dd}"
    }
  }
}
6.页面查看结果
# 测试结果
页面访问http://10.0.0.51:9200查看是否存在nginx和tomcat对应的日志索引
二、通过TCP/UDP收集日志
0.建议
# 说明:
一般情况不建议使用下面的方式进行日志收集,只是展示说明logstash支持通过tcp/udp方式进行日志收集。。。
1.配置收集日志
# 收集当前服务器的1234端口的消息,屏幕输出
[root@web01 ~]# vim /etc/logstash/conf.d/tcp.conf
input {
  tcp {
    port => "1234"
    mode => "server"
  }
}
output {
  stdout {}
}
2.使用telnet测试
# telnet连接至logstash(web01)日志收集1234端口的服务器,成功后随意输入,发现web01屏幕输出对应消息。
[root@db02 ~]# telnet 172.16.1.7 1234
Trying 172.16.1.7...
Connected to 172.16.1.7.
Escape character is '^]'.
123
345

#输出内容
{
    "@timestamp" => 2020-08-17T02:23:05.833Z,
          "host" => "172.16.1.52",
          "port" => 33002,
       "message" => "
",
      "@version" => "1"
}
{
    "@timestamp" => 2020-08-17T02:23:32.562Z,
          "host" => "172.16.1.52",
          "port" => 33002,
       "message" => "123
",
      "@version" => "1"
}
{
    "@timestamp" => 2020-08-17T02:23:38.300Z,
          "host" => "172.16.1.52",
          "port" => 33002,
       "message" => "345
",
      "@version" => "1"
}
3.使用nc工具测试
# 工具说明:
· 此工具和telnet类似,支持将消息输出至其他服务器中

#安装
[root@db02 ~]# yum install -y nc

#使用nc工具
[root@db02 ~]# nc 172.16.1.7 1234
123
456

#使用nc工具收集日志到logstash的服务器
[root@web01 ~]# tail -f /var/log/nginx/access.log | nc 10.0.0.7 1234 &
[1] 29595

#发送伪设备数据(此操作就将echo输出内容发送至10.0.0.7:1234中)
[root@web01 ~]# echo "伪设备测试" > /dev/tcp/10.0.0.7/1234
4.收集日志到ES
# 将本地开放的1234端口中的消息输出到es中
[root@web01 ~]# vim /etc/logstash/conf.d/tcp.conf
input {
  tcp {
    port => "1234"
    mode => "server"
  }
}
output {
  elasticsearch {
    hosts => ["10.0.0.51:9200"]
    index => "tcp_log_%{+YYYY-MM-dd}"
  }
}
三、Logstash配合rsyslog收集haproxy日志

1.rsyslog介绍
在centos 6及之前的版本叫做syslog,centos 7开始叫做rsyslog,根据官方的介绍,rsyslog(2013年版本)可以达到每秒转发百万条日志的级别,官方网址:http://www.rsyslog.com/
2.安装
[root@web01 ~]# yum isntall -y rsyslog
3.配置rsyslog
[root@web01 ~]# vim /etc/rsyslog.conf
#打开注释
$ModLoad imudp
$UDPServerRun 514
$ModLoad imtcp
$InputTCPServerRun 514
#添加日志收集级别,指定这个级别中的日志发送至对应ip端口中去
local6.*       @@172.16.1.52:2222
4.安装haproxy
[root@web01 ~]# yum install -y haproxy
5.配置haproxy
[root@web01 ~]# vim /etc/haproxy/haproxy.cfg
global
maxconn 100000
chroot /var/lib/haproxy
uid 99
gid 99
daemon
nbproc 1
pidfile /var/run/haproxy.pid
log 127.0.0.1 local6 info

defaults
option http-keep-alive
option  forwardfor
maxconn 100000
mode http
timeout connect 300000ms
timeout client  300000ms
timeout server  300000ms

listen stats
 mode http
 bind 0.0.0.0:9999
 stats enable
 log global
 stats uri     /haproxy-status
 stats auth    haadmin:123456

#frontend web_port
frontend web_port
        bind 0.0.0.0:80
        mode http
        option httplog
        log global
        option  forwardfor
###################ACL Setting##########################
        acl pc          hdr_dom(host) -i www.elk.com
        acl mobile      hdr_dom(host) -i m.elk.com
###################USE ACL##############################
        use_backend     pc_host        if  pc
        use_backend     mobile_host    if  mobile
########################################################

backend pc_host
        mode    http
        option  httplog
        balance source
        server web1  10.0.0.53:8081 check inter 2000 rise 3 fall 2 weight 1

backend mobile_host
        mode    http
        option  httplog
        balance source
        server web1  10.0.0.53:8080 check inter 2000 rise 3 fall 2 weight 1


[root@web01 ~]# vim /etc/haproxy/haproxy.cfg
#全局配置
global
#最大并发
maxconn 100000
#安全机制
chroot /var/lib/haproxy
#指定启动的用户和组
uid 99
gid 99
#守护进程
daemon
#haproxy的进程数
nbproc 1
#指定pid文件
pidfile /var/run/haproxy.pid
#指定日志级别
log 127.0.0.1 local6 info

#默认配置
defaults
#开启长连接
option http-keep-alive
#获取用户真实IP
option  forwardfor
#最大连接数
maxconn 100000
#支持http协议
mode http
#设置连接超时时间
timeout connect 300000ms
timeout client  300000ms
timeout server  300000ms

#监控状态
listen status
 #支持http
 mode http
 #监听端口
 bind 0.0.0.0:9999
 #启动
 stats enable
 #日志级别
 log global
 #访问uri地址
 stats uri     /haproxy-status
 #状态页用户名和密码
 stats auth    haadmin:123456

#frontend web_port
frontend web_port
        bind 0.0.0.0:80
        mode http
        option httplog
        log global
        option  forwardfor
###################ACL Setting##########################
        acl nginx       hdr_dom(host) -i www.nginx.com  # 当访问此域名就代理到名为acl的nginx中
        acl tomcat      hdr_dom(host) -i www.tomcat.com # 当访问此域名就代理到名为acl的tomcat中
###################USE ACL##############################
        use_backend     nginx_host     if  nginx		# 根据上面acl的nginx名称对应这里的nginx_host
        use_backend     tomcat_host    if  tomcat		#根据上面acl的tomcat名称对应这里的nginx_host
########################################################

backend nginx_host				# 根据上面的nginx_host对应到这里,代理到10.0.0.7:8081中
        mode    http
        option  httplog
        balance source
        server web01  10.0.0.7:8081 check inter 2000 rise 3 fall 2 weight 1

backend tomcat_host				# 根据上面的nginx_host对应到这里,代理到10.0.0.7:8081中
        mode    http
        option  httplog
        balance source
        server web01  10.0.0.7:8080 check inter 2000 rise 3 fall 2 weight 1
6.修改Nginx启动端口
[root@web01 ~]# vim /etc/nginx/nginx.conf			# 因为nginx上安装了haproxy防止冲突,改变端口号
    server {
        listen       8081 default_server;
        ...
7.启动服务
#启动haproxy(一旦haporxy产生日志,通过rsyslog发送至其他服务器中)
[root@web01 ~]# systemctl start haproxy.service

#启动rsyslog
[root@web01 ~]# systemctl start rsyslog

#验证
[root@web01 ~]# netstat -lntp
8.访问状态页面
http://10.0.0.7:9999/haproxy-status
haadmin
123456
9.测试访问Nginx和tomcat
#配置本地hosts
10.0.0.7 www.nginx.com
10.0.0.7 www.tomcat.com

#访问页面
http://www.nginx.com/
http://www.tomcat.com/
10.测试配置收集proxy日志
[root@db02 ~]# vim /etc/logstash/conf.d/haproxy.conf
input {
  syslog {
    port => "2222"
  }
}
output {
  stdout {}
}

#访问haproxy的页面,查看有无输出
11.配置收集proxy日志到ES
# 使用logstash时指定收集2222端口的消息,默认这种方式就是开启一个端口的方式
[root@db02 ~]# vim /etc/logstash/conf.d/haproxy_es.conf
input {
  syslog {
    port => "2222"
  }
}
output {
  elasticsearch {
    hosts => ["10.0.0.51:9200"]
    index => "haproxy_log_%{+YYYY-MM-dd}"
  }
}