LK是三个开源软件的缩写,分别表示:Elasticsearch , Logstash, Kibana 。
Elasticsearch是个开源分布式搜索引擎,提供搜集、分析、存储数据三大功能。它的特点有:分布式,零配置,自动发现,索引自动分片,索引副本机制,restful风格接口,多数据源,自动搜索负载等。
Logstash 主要是用来日志的搜集、分析、过滤日志的工具,支持大量的数据获取方式。一般工作方式为c/s架构,client端安装在需要收集日志的主机上,server端负责将收到的各节点日志进行过滤、修改等操作在一并发往elasticsearch上去。
Kibana 也是一个开源和免费的工具,Kibana可以为 Logstash 和 ElasticSearch 提供的日志分析友好的 Web 界面,可以帮助汇总、分析和搜索重要数据日志。
Filebeat隶属于Beats。目前Beats包含四种工具:
- Packetbeat(搜集网络流量数据)
- Topbeat(搜集系统、进程和文件系统级别的 CPU 和内存使用情况等数据)
- Filebeat(搜集文件数据)
- Winlogbeat(搜集 Windows 事件日志数据)
参考内容:https://www.extlight.com/2017/09/27/Elasticsearch-%E5%9F%BA%E7%A1%80%E5%85%A5%E9%97%A8/
1.安装elasticsearch
登陆 elasticSearch 官网下载文件:
elasticsearch-6.3.2
因为 Elasticsearch 可以执行脚本文件,为了安全性,默认不允许通过 root 用户启动服务。我们需要新创建用户名和用户组启动服务:
#增加 es 组
groupadd es

#增加 es 用户并附加到 es 组
useradd es -g es -p es

#给目录权限
chown -R es:es elasticsearch-5.6.1

#使用es用户
su es
Elasticsearch 只允许本机访问,如果需要远程访问,需要修改其配置文件
vim config/elasticsearch.yml

# 去掉 network.host 前边的注释,将它的值改成0.0.0.0
network.host: 0.0.0.0
启动报错:max file descriptors [4096] for elasticsearch process is too low, increase to at least [65536]
max virtual memory areas vm.max_map_count [65530] is too low, increase to at least [262144]
system call filters failed to install; check the logs and fix your configuration or disable system call filters at your own risk
在文件中修改配置:
/etc/security/limits.conf
* soft nofile 10240
* hard nofile 10240
修改/etc/sysctl.conf
vim /etc/sysctl.conf
vm.max_map_count=262144
保存,并执行 sysctl -p
在elasticsearch.yml中配置bootstrap.system_call_filter为false,注意要在Memory下面:
bootstrap.memory_lock: false
bootstrap.system_call_filter: false
修改配置后就能正常启动项目了:

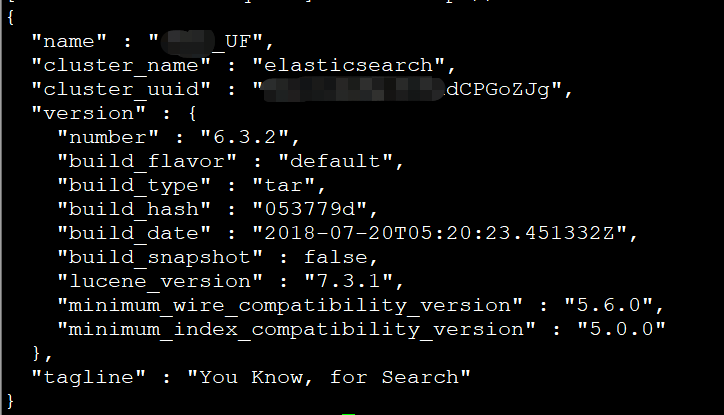
访问地址: http://localhost:9200
安装插件
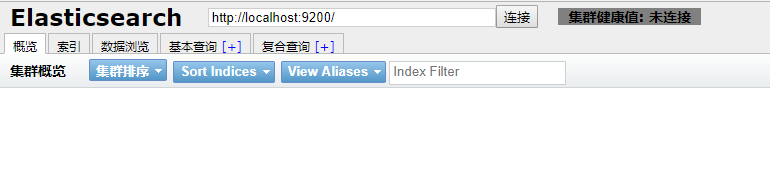
访问 http://localhost:9200 查看内容显示效果不友好,因此,我们需要安装一个名为 elasticsearch-head 的插件,让内容显示效果比较舒适。
从GitHub 网站下载mobz/elasticsearch-head :
wget https://github.com/mobz/elasticsearch-head/archive/master.zip

unzip master.zip

cd elasticsearch-head-master
安装 node、npm、grunt
#node 下载地址 nodejs.org/ (版本最好不低于 4.5)#解压到安装目录,执行以下命令
ln -s /usr/install/node/node-v6.11.3-linux-x64/bin/node /usr/local/bin/node
#执行完毕后, node –v 查看版本号
ln -s /usr/install/node/node-v6.11.3-linux-x64/bin/npm /usr/local/bin/npm
#执行完毕后, npm –v 查看版本
设置 npm 代理镜像
#执行
npm config set registry https://registry.npm.taobao.org
npm info underscore( 查看某个模块最新发布版本信息,验证是否设置成功)
修改 Elasticsearch 配置文件
#编辑 elasticsearch-5.1.1/config/elasticsearch.yml,
#加入以下内容:
http.cors.enabled: true
http.cors.allow-origin: "*"
修改 Gruntfile.js
进入master目录:
#打开 elasticsearch-head-master/Gruntfile.js,找到
#下面的 connect 属性,新增hostname:‘172.18.210.50’:

connect: {
    server: {
        options: {
            hostname: '172.18.210.50',
            port: 9100,
            base: '.',
            keepalive: true
            }
        }
    }
执行 npm install
npm install --unsafe-perm
安装 grunt
#安装
npm install –g grunt
#创建软链
ln -s /usr/install/node/node-v6.11.3-linux-x64/bin/grunt /usr/local/bin/grunt
执行命令启动 head
grunt server
后台启动命令
nohup grunt server &
浏览器访问