目录
一、部署Prometheus+grafana环境
  1.1、下载Prometheus+grafana镜像
  1.2、创建镜像
  1.3、浏览器访问
二、监控Linux主机
  2.1、在被监控主机上部署node_exporter软件
  2.2、修改prometheus的配置文件
  2.3、浏览器访问
三、监控Windows主机
  3.1、在被监控主机上部署wmi-exporter软件
  3.2、修改prometheus的配置文件
  3.3、浏览器访问
四、监控MySQL实例
  4.1、配置被监控的MySQL实例
  4.2、修改prometheus的配置文件
  4.3、浏览器访问
五、监控Oracle实例
  5.1、配置被监控的Oracle实例
  5.2、修改prometheus的配置文件
  5.3、浏览器访问
六、测试邮件告警功能
  6.1、测试MySQL宕机
  6.2、测试Linux宕机
七、总结
一、部署Prometheus+grafana环境
1.1、下载Prometheus+grafana镜像
[root@docker36 ~]# docker pull registry.cn-hangzhou.aliyuncs.com/lhrbest/lhrprometheus:1.0
1.0: Pulling from lhrbest/lhrprometheus
c1e1cb5fc6d2: Already exists
d7889870c229: Pull complete
Digest: sha256:6d2aea56026f4fdb17554b5ad0842766cb8e99a492382b6553ab330d0eb19c4b
Status: Downloaded newer image for registry.cn-hangzhou.aliyuncs.com/lhrbest/lhrprometheus:1.0
registry.cn-hangzhou.aliyuncs.com/lhrbest/lhrprometheus:1.0
[root@docker36 ~]# docker tag registry.cn-hangzhou.aliyuncs.com/lhrbest/lhrprometheus:1.0 lhrbest/lhrprometheus:1.0
1.2、创建镜像
[root@docker36 ~]# ip addr | grep 66
    inet 192.168.66.36/24 brd 192.168.66.255 scope global edge0
[root@docker36 ~]# docker run -d --name lhrprometheus01 -h lhrprometheus01
>   -p 2222:22 -p 23389:3389 -p 29090:9090 -p 29093:9093 -p 23000:3000
>   --privileged=true lhrbest/lhrprometheus:1.0
>   /usr/sbin/init
fed3d3ea7275ec337e305a76d5694473a2637be4c71d22e46e669a5ec3b39e57
[root@docker36 ~]# docker exec -it lhrprometheus01 bash
[root@lhrprometheus01 /]#
其中,9090是Prometheus的端口,3000是grafana的端口,3389是Linux远程桌面的端口。
  在本文中,需要注意以下内容:

  1、在该镜像中,已安装了prometheus 2.23版本,grafana 7.3.6版本,alertmanager 0.21版本,node_exporter 1.0.1版本,mysqld_exporter 0.12.1版本,oracledb_exporter 0.2.9版本

  2、192.168.66.36是Prometheus和grafana的IP地址

  3、程序和默认端口对应关系
端口   程序
9090  prometheus
3000  grafana
9093  alter_manager
9100  node_exporter
9104  mysqld_exporter
9121  redis_exporter
9161  oracledb_exporter
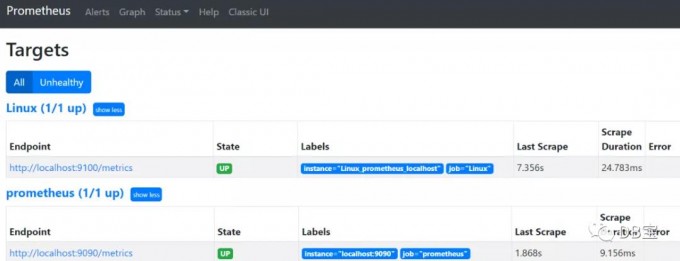
1.3、浏览器访问
访问普罗米修斯(Prometheus):http://192.168.66.36:29090/targets
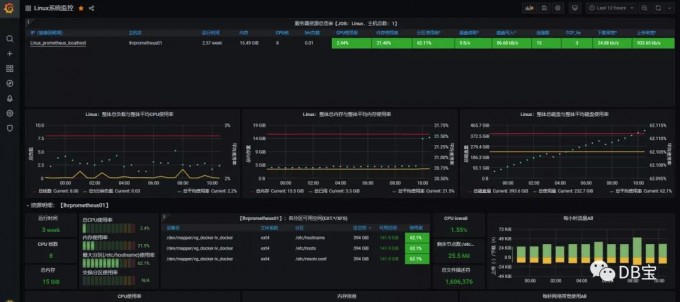
  访问Grafana:http://192.168.66.36:23000   用户名和密码都是admin

  默认的Linux系统监控可以看到如下界面:
二、监控Linux主机
2.1、在被监控主机上部署node_exporter软件
  需要在被监控的主机上安装node_exporter软件,下载地址:https://prometheus.io/download/

  最新版本为:node_exporter-1.0.1.linux-amd64.tar.gz

  或者直接将本机的/usr/local/bin/node_exporter文件拷贝到需要被监控的主机上也可以。

  假设我这里需要被监控的主机为:121.36.8.186,那么在该主机上执行如下命令:
1nohup /usr/local/bin/node_exporter &
检查,node_exporter默认端口为9100:
[root@ecs ~]# netstat -anp | grep 9100
tcp6       0      0 :::9100                 :::*                    LISTEN      24995/node_exporter
tcp6       0      0 10.0.0.134:9100         210.52.224.155:58598    ESTABLISHED 24995/node_exporter
[root@ecs ~]# lsof -i:9100
COMMAND     PID USER   FD   TYPE  DEVICE SIZE/OFF NODE NAME
node_expo 24995 root    3u  IPv6 8125597      0t0  TCP *:jetdirect (LISTEN)
node_expo 24995 root    8u  IPv6 8203663      0t0  TCP ecs:jetdirect->210.52.224.155:58598 (ESTABLISHED)
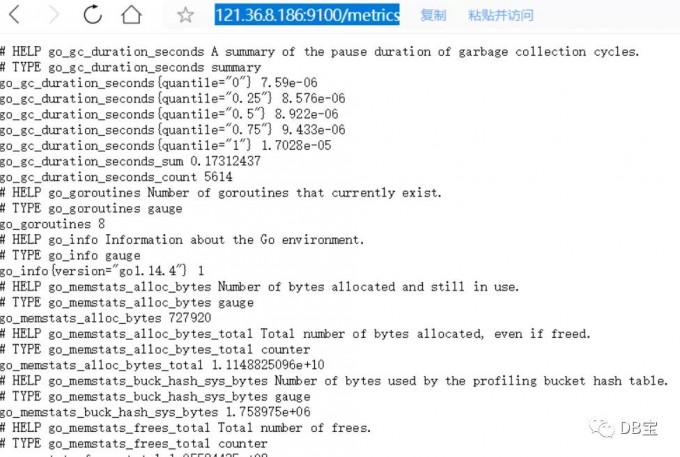
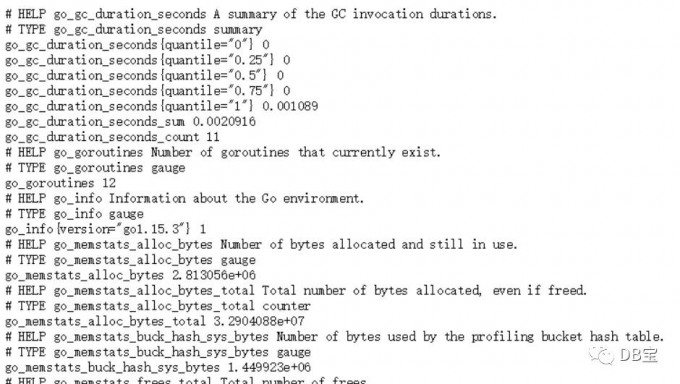
命令行直接访问:
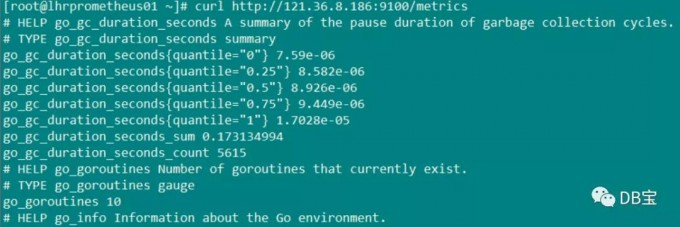
浏览器访问http://121.36.8.186:9100/metrics ,返回:
2.2、修改prometheus的配置文件
修改prometheus的配置文件(/usr/local/prometheus/prometheus.yml),添加第6-8行:
  - job_name: 'Linux'
    static_configs:
    - targets: ['localhost:9100']
      labels:
        instance: Linux_prometheus_localhost
    - targets: ['121.36.8.186:9100']
      labels:
        instance: Linux_121.36.8.186
通过命令热加载:
curl -XPOST http://localhost:9090/-/reload
2.3、浏览器访问
此时再刷新访问:http://192.168.66.36:29090/targets
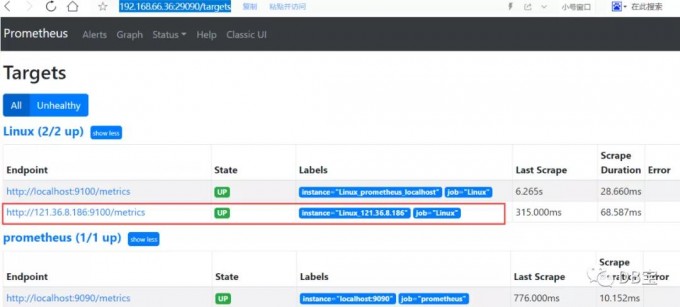
发现新主机已经被监控到了。此时再去grafana页面查询:
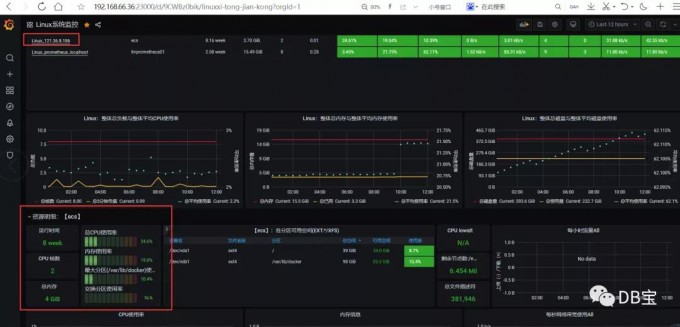
发现已经有数据了。
三、监控Windows主机
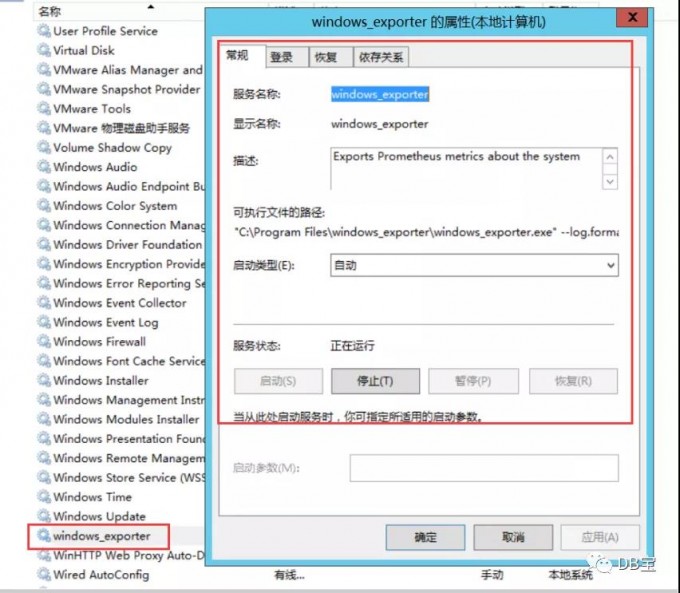
3.1、在被监控主机上部署wmi-exporter软件
  在需要被监控windows机器安装wmi-exporter,下载节点监控程序并运行,默认端口9182,下载地址:https://github.com/martinlindhe/wmi_exporter

  安装完成后,默认安装了service,软件安装路径为:C:Program Fileswindows_exporter
浏览器访问:http://192.168.66.236:9182/metrics,出现如下信息则,客户端节点正常
3.2、修改prometheus的配置文件
修改prometheus的配置文件(/usr/local/prometheus/prometheus.yml),添加第1-3行:
  - job_name: 'Windows'
    static_configs:
    - targets: ['192.168.66.236:9182']
通过命令热加载:
curl -XPOST http://localhost:9090/-/reload
3.3、浏览器访问
此时再刷新访问:http://192.168.66.36:29090/targets
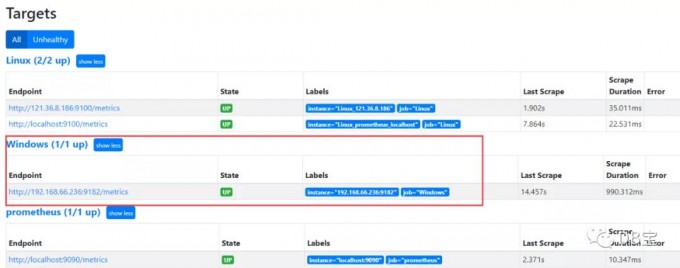
发现新主机已经被监控到了。此时再去grafana页面查询:
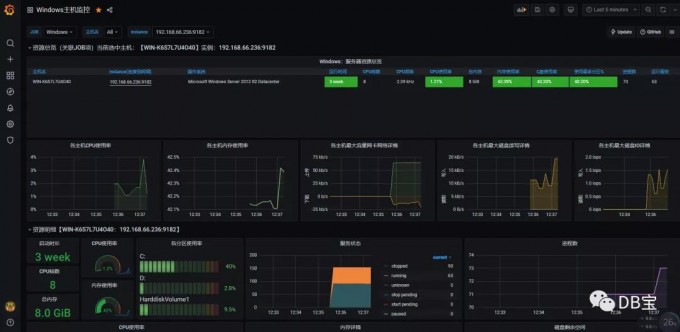
发现已经有数据了。
四、监控MySQL实例
4.1、配置被监控的MySQL实例
  监控MySQL实例需要用到mysqld_exporter软件,下载地址:https://prometheus.io/download/

  监控MySQL实例可以分为2种部署方式:

1、分离部署+环境变量

  这种方式是在每个mysql服务器上跑一个exporter程序,比如10.10.20.14服务器上跑自己的mysqld_exporter,而登到10.10.20.15服务器上也启动自己的mysqld_exporter,也就是分离部署,这样的话每个mysql服务器上除了mysqld进程外还会多一个mysqld_exporter的进程。部署方式(本文不使用这种方式):
export DATA_SOURCE_NAME='root:lhr@(192.168.66.35:3317)/'
nohup mysqld_exporter 1>/dev/null 2>&1 &
2、集中部署+配置文件

  如果我们想要保持mysql服务器零入侵的纯净环境,这时候就可以尝试一下集中部署+配置文件的方式。集中部署,就是说我们将所有的mysqld_exporter部署在同一台服务器上,在这台服务器上对mysqld_exporter进行统一的管理。
本文,我们采用第2种方式部署。所以,直接在容器lhrprometheus01内进行配置:
 mkdir -p /etc/mysqld_exporter/
 cd /etc/mysqld_exporter/

 cat > mysql573317.cnf << "EOF"
 [client]
 user=root
 7password=lhr
 8host=192.168.66.35
 9port=3317
EOF

cat > mysql803318.cnf << "EOF"
[client]
user=root
password=lhr
host=192.168.66.35
port=3318
EOF

unset DATA_SOURCE_NAME
nohup mysqld_exporter --web.listen-address=localhost:9104 --config.my-cnf=/etc/mysqld_exporter/mysql573317.cnf 1>/dev/null 2>&1 &
nohup mysqld_exporter --web.listen-address=localhost:9105 --config.my-cnf=/etc/mysqld_exporter/mysql803318.cnf 1>/dev/null 2>&1 &

-- 校验是否配置成功
curl http://localhost:9104/metrics
26curl http://localhost:9105/metrics
4.2、修改prometheus的配置文件
修改prometheus的配置文件(/usr/local/prometheus/prometheus.yml),添加第1-8行:
  - job_name: 'MySQL'
    static_configs:
    - targets: ['localhost:9104']
      labels:
        instance: MySQL_192.168.66.35:3317
    - targets: ['localhost:9105']
      labels:
        instance: MySQL_192.168.66.35:3318
通过命令热加载:
curl -XPOST http://localhost:9090/-/reload
4.3、浏览器访问
此时再刷新访问:http://192.168.66.36:29090/targets
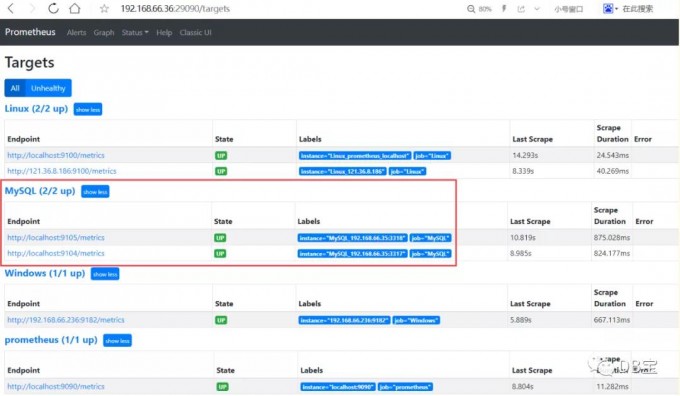
发现MySQL实例已经被监控到了。此时再去grafana页面查询:
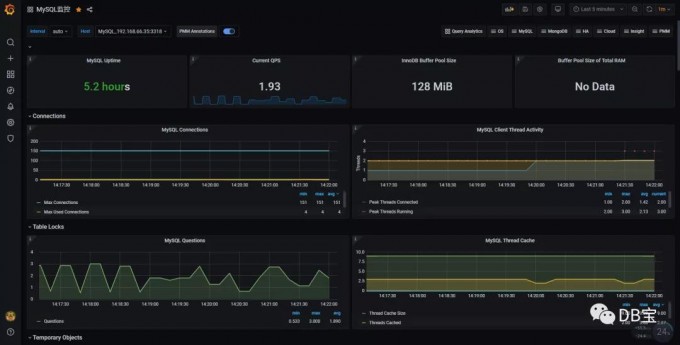
发现已经有数据了。
五、监控Oracle实例
5.1、配置被监控的Oracle实例
  监控Oracle数据库,需要安装oracle exporter,下载地址:https://github.com/iamseth/oracledb_exporter/releases

  监控Oracle和MySQL一样,可以对原Oracle服务器零入侵,只需在Prometheus服务器上做配置即可,执行如下命令即可:
export DATA_SOURCE_NAME='lhr/lhr@192.168.66.35:1523/LHR11G'
nohup oracledb_exporter -default.metrics /usr/local/oracledb_exporter/default-metrics.toml -web.listen-address 0.0.0.0:9161 &
注意:由于9161端口没有对外暴露,所以,需要进入Linux的远程桌面访问,打开mstsc
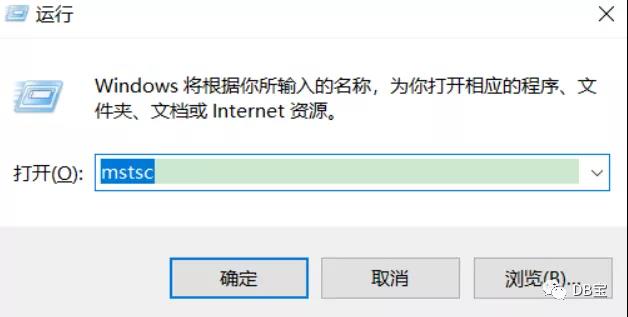
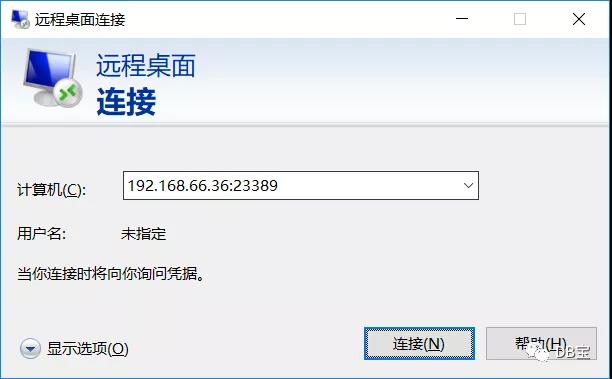
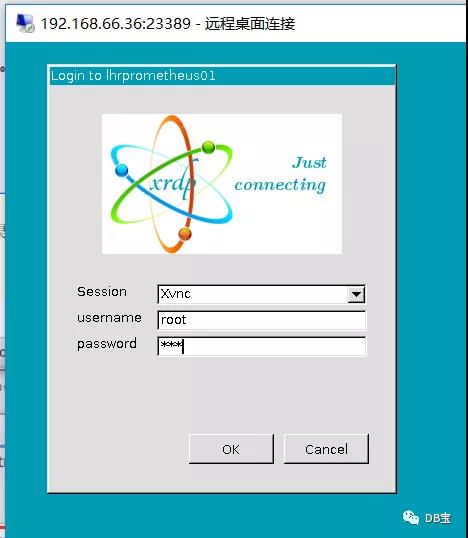
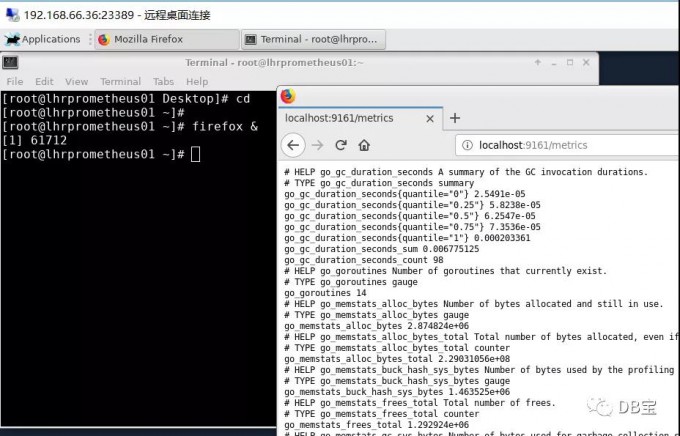
192.168.66.36是Prometheus所在的服务器,进入远程桌面,用户名为root,密码为lhr,打开firefox浏览器即可访问。浏览器访问:http://localhost:9161/metrics,若出现如下信息,则说明客户端节点正常。
5.2、修改prometheus的配置文件
修改prometheus的配置文件(/usr/local/prometheus/prometheus.yml),添加第1-5行:
  - job_name: 'Oracle'
    static_configs:
    - targets: ['localhost:9161']
      labels:
        instance: Oracle_192.168.66.35:1523
通过命令热加载:
curl -XPOST http://localhost:9090/-/reload
5.3、浏览器访问
此时再刷新访问:http://192.168.66.36:29090/targets
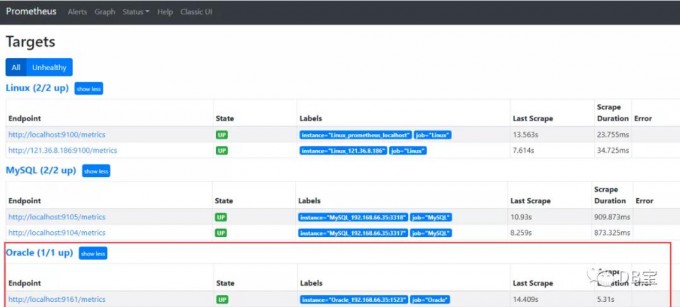
发现新主机已经被监控到了。此时再去grafana页面查询:
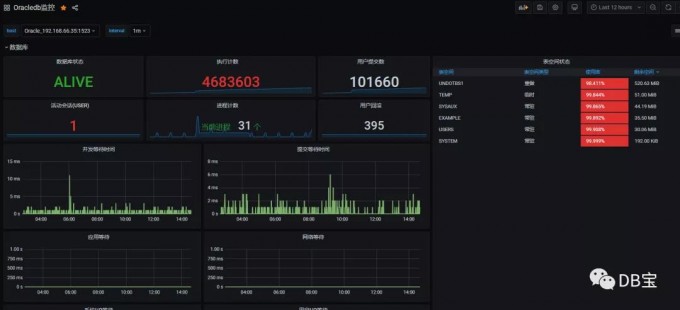
发现已经有数据了。
六、测试邮件告警功能
  本镜像环境已经配置了MySQL和Linux服务器的邮件告警功能,可以登录http://192.168.66.36:29090/alerts查看,相关的规则详情可以参考:http://192.168.66.36:29090/rules

  告警的默认收件人是lhrbest@qq.com,若想修改收件人地址,那么可以修改文件/usr/local/alertmanager/alertmanager.yml,将其中的lhrbest@qq.com修改成自己的邮箱即可。在修改完成后,记得重启alertmanager软件,启动命令如下:
pkill alertmanager
nohup alertmanager --config.file=/usr/local/alertmanager/alertmanager.yml &
6.1、测试MySQL宕机
关闭MySQL服务器:
C:Userslhrxxt>mysql -uroot -plhr -h192.168.66.35 -P3317
mysql: [Warning] Using a password on the command line interface can be insecure.
Welcome to the MySQL monitor. Commands end with ; or g.
Your MySQL connection id is 1003
Server version: 5.7.30-log MySQL Community Server (GPL)
Copyright (c) 2000, 2020, Oracle and/or its affiliates. All rights reserved.
Oracle is a registered trademark of Oracle Corporation and/or its
affiliates. Other names may be trademarks of their respective
owners.
Type 'help;' or 'h' for help. Type 'c' to clear the current input statement.
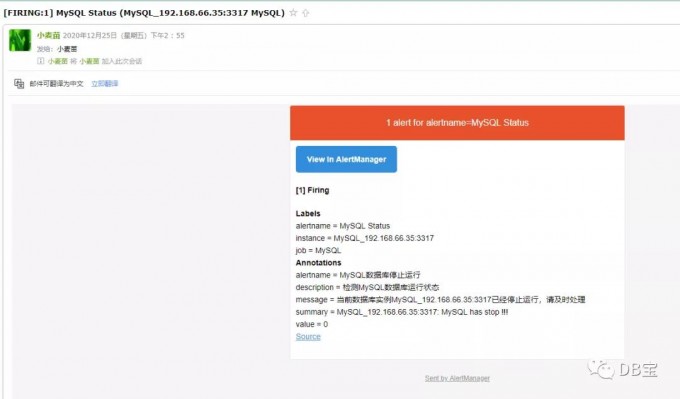
MySQL [(none)]> shutdown ;
Query OK, 0 rows affected (0.05 sec)
收到邮件:
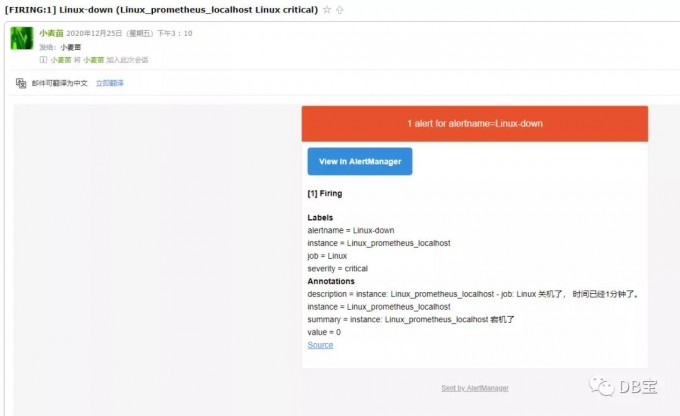
6.2、测试Linux宕机
首先关闭相关主机,等待收邮件:
七、总结
如何?一番感受下来,是不是很爽!!!
当然,Prometheus还可以监控其它很多内容,例如SQL Server、PG、Redis、MongoDB、K8s、ES等,这里不再演示