Filebeat收集单个日志
1.配置收集日志到文件
[root@web01 ~]# vim /etc/filebeat/filebeat.yml
filebeat.inputs:
- type: log
  enable: true
  paths:
    - /var/log/nginx/access.log
output.file:
  path: "/tmp"
  filename: "filebeat.log"
2.配置收集日志到ES
[root@web01 ~]# vim /etc/filebeat/filebeat.yml
filebeat.inputs:
- type: log
  enable: true
  paths:
    - /var/log/nginx/access.log
output.elasticsearch:
  hosts: ["10.0.0.51:9200"]
3.配置收集日志为json格式
1)配置
#由于收集日志内容还是写到了message,没有办法作图
[root@web01 ~]# vim /etc/filebeat/filebeat.yml
filebeat.inputs:
- type: log
  enable: true
  paths:
    - /var/log/nginx/access.log
  json.keys_under_root: true
  json.overwrite_keys: true
output.elasticsearch:
  hosts: ["10.0.0.51:9200"]
2)指定分片数
[root@web01 ~]# vim /etc/filebeat/filebeat.yml.bak
setup.template.settings:
  index.number_of_shards: 3
使用filebeat收集nginx日志相关问题
json格式
1.修改nginx日志格式
[root@web01 filebeat]# vim /etc/nginx/nginx.conf
...
log_format log_json '{ "time_local": "$time_local", '
'"remote_addr": "$remote_addr", '
'"referer": "$http_referer", '
'"request": "$request", '
'"status": $status, '
'"bytes": $body_bytes_sent, '
'"agent": "$http_user_agent", '
'"x_forwarded": "$http_x_forwarded_for", '
'"up_addr": "$upstream_addr",'
'"up_host": "$upstream_http_host",'
'"upstream_time": "$upstream_response_time",'
'"request_time": "$request_time" }';
access_log /var/log/nginx/access.log log_json;
...
2.配置filebeat
[root@web01 filebeat]# vim filebeat.yml
filebeat.inputs:
- type: log
enable: true
paths:
- /var/log/nginx/access.log
output.elasticsearch:
hosts: ["10.0.0.51:9200"]
3.重启filebeat
[root@web01 filebeat]# systemctl restart filebeat.service
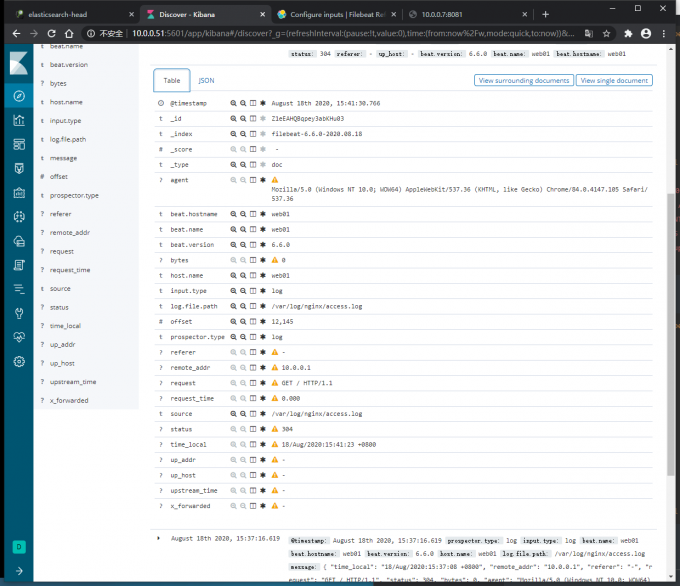
4.kibana查看数据格式
{ "time_local": "18/Aug/2020:15:37:08 +0800", "remote_addr": "10.0.0.1", "referer": "-", "request": "GET / HTTP/1.1", "status": 304, "bytes": 0, "agent": "Mozilla/5.0 (Windows NT 10.0; WOW64) AppleWebKit/537.36 (KHTML, like Gecko) Chrome/84.0.4147.105 Safari/537.36", "x_forwarded": "-", "up_addr": "-","up_host": "-","upstream_time": "-","request_time": "0.000" }
使nginx日志格式转化为key:value
[root@web01 filebeat]# vim filebeat.yml
filebeat.inputs:
- type: log
  enable: true
  paths:
    - /var/log/nginx/access.log

  json.keys_under_root: true
  json.overwrite_keys: true

output.elasticsearch:
  hosts: ["10.0.0.51:9200"]

[root@web01 filebeat]# systemctl restart filebeat.service
kibana出图
修改索引名字
[root@web01 filebeat]# vim filebeat.yml
filebeat.inputs:
- type: log
  enable: true
  paths:
    - /var/log/nginx/access.log
  json.keys_under_root: true
  json.overwrite_keys: true

output.elasticsearch:
  hosts: ["10.0.0.51:9200"]
  index: "nginx_log_%{+YYYY-MM-dd}"
setup.template.enabled: "false"
setup.template.name: "filebeat"
setup.template.pattern: "filebeat-*"

#通过head插件可以看到索引名字被修改,通过kibana可以看到数据格式为key:value
#filebeat只能记录新产生的日志,logstash既可以记录新产生的日志,也可以以前的日志
指定分片数
[root@web01 filebeat]# vim filebeat.yml
filebeat.inputs:
- type: log
  enable: true
  paths:
    - /var/log/nginx/access.log
  json.keys_under_root: true
  json.overwrite_keys: true

output.elasticsearch:
  hosts: ["10.0.0.51:9200"]
  index: "nginx_log_%{+YYYY-MM-dd}"
setup.template.enabled: "false"
setup.template.name: "filebeat"
setup.template.pattern: "filebeat-*"
setup.template.settings:
  index.number_of_shards: 3
redis做消息队列
收集nginx日志到redis
1.配置filebeat
[root@web01 filebeat]# vim filebeat.yml
filebeat.inputs:
- type: log
  enable: true
  paths:
    - /var/log/nginx/access.log

  json.keys_under_root: true
  json.overwrite_keys: true

output.redis:
  hosts: ["172.16.1.51"]
  port: 6379
  key: "nginx_log"
  db: 0
  timeout: 5
2.浏览器访问nginx,登录redis查看队列,格式为json
[root@db01 config]# redis-cli
127.0.0.1:6379> keys *
1) "nginx_log"
127.0.0.1:6379> LLEN nginx_log
(integer) 16
127.0.0.1:6379> LRANGE nginx_log 0 -1
 1) "{"@timestamp":"2020-08-18T08:25:43.433Z","@metadata":{"beat":"filebeat","type":"doc","version":"6.6.0"},"status":304,"up_host":"-","offset":14774,"request":"GET / HTTP/1.1","bytes":0,"request_time":"0.000","time_local":"18/Aug/2020:16:23:14 +0800","remote_addr":"10.0.0.1","log":{"file":{"path":"/var/log/nginx/access.log"}},"input":{"type":"log"},"upstream_time":"-","agent":"Mozilla/5.0 (Windows NT 10.0; WOW64) AppleWebKit/537.36 (KHTML, like Gecko) Chrome/84.0.4147.105 Safari/537.36","x_forwarded":"-","prospector":{"type":"log"},"beat":{"name":"web01","hostname":"web01","version":"6.6.0"},"host":{"name":"web01"},"source":"/var/log/nginx/access.log","up_addr":"-","referer":"-"}"
使用logstash把redis中的数据收集到es
#配置logstash
[root@db01 conf.d]# vim nginx_redis_es.conf
input {
  redis {
    host => "172.16.1.51"
    port => "6379"
    db => "0"
    data_type => "list"
    key => "nginx_log"
  }
}
output {
  elasticsearch {
    hosts => ["10.0.0.51:9200"]
    index => "nginx_access_%{+YYYY-MM-dd}"
  }
}

#启动logstash
[root@db01 conf.d]# logstash -f nginx_redis_es.conf

#进入redis可以看到队列数据的数量变化,通过head插件可以看到es索引的生成,通过kibana可以看到数据的格式
搭建 nginx -- filebeast -- logstash -- es
1.配置nginx日志格式
[root@web01 filebeat]# vim /etc/nginx/nginx.conf
...
log_format log_json '{ "time_local": "$time_local", '
'"remote_addr": "$remote_addr", '
'"referer": "$http_referer", '
'"request": "$request", '
'"status": $status, '
'"bytes": $body_bytes_sent, '
'"agent": "$http_user_agent", '
'"x_forwarded": "$http_x_forwarded_for", '
'"up_addr": "$upstream_addr",'
'"up_host": "$upstream_http_host",'
'"upstream_time": "$upstream_response_time",'
'"request_time": "$request_time" }';
access_log /var/log/nginx/access.log log_json;
...
2.配置filebeat
[root@web01 filebeat]# vim filebeat.yml
filebeat.inputs:
- type: log
enable: true
paths:
- /var/log/nginx/access.log
json.keys_under_root: true
json.overwrite_keys: true
output.logstash:
hosts: ["172.16.1.51:3456"]
3.配置logstash,logstash启动之后随即端口开启
[root@db01 conf.d]# vim nginx_access_filebeat_logstash_es.conf
input {
beats {
port => "3456"
codec => "json"
}
}
output {
elasticsearch {
hosts => ["10.0.0.51:9200"]
index => "nginx_filebeat_es_%{+YYYY-MM-dd}"
}
}
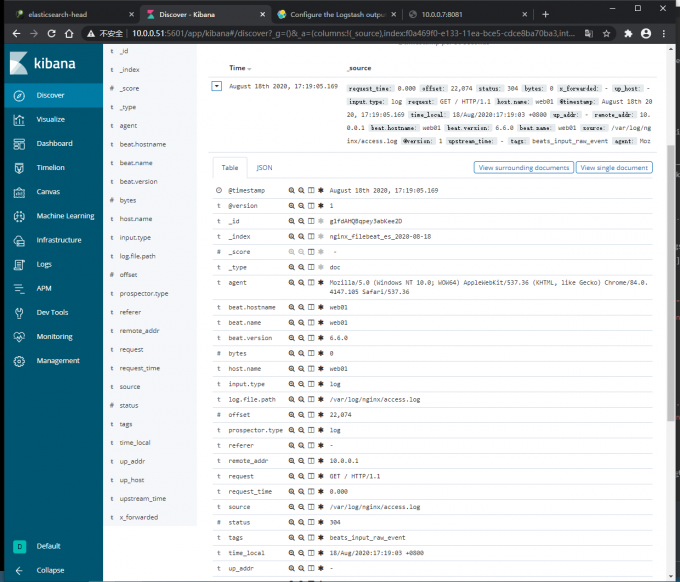
4.kibana查看日志格式如下
filebeat收集多日志到es
方法一
1.配置filebeat
[root@web01 filebeat]# vim filebeat.yml
filebeat.inputs:
- type: log
enable: true
paths:
- /var/log/nginx/access.log
json.keys_under_root: true
json.overwrite_keys: true
- type: log
enable: true
paths:
- /var/log/messages
output.elasticsearch:
hosts: ["10.0.0.51:9200"]
indices:
- index: "nginx_%{+YYYY-MM-dd}"
when.contains:
source: /var/log/nginx/access.log
- index: "messages_%{+YYYY-MM-dd}"
when.contains:
source: /var/log/messages
setup.template.enabled: "false"
setup.template.name: "filebeat"
setup.template.pattern: "filebeat-*"
2.浏览器访问nginx
[root@web01 filebeat]# echo 123 >> /var/log/messages
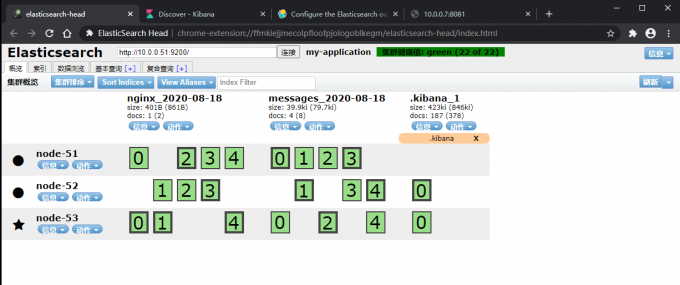
3.head插件,kibana查看日志
方法二
#打标签
[root@web01 filebeat]# vim filebeat.yml
filebeat.inputs:
- type: log
  enable: true
  paths:
    - /var/log/nginx/access.log
  tags: ["nginx"]

  json.keys_under_root: true
  json.overwrite_keys: true

- type: log
  enable: true
  paths:
    - /var/log/messages
  tags: ["messages"]

output.elasticsearch:
  hosts: ["10.0.0.51:9200"]
  indices:
    - index: "nginx_%{+YYYY-MM-dd}"
      when.contains:
        tags: "nginx"
    - index: "messages_%{+YYYY-MM-dd}"
      when.contains:
        tags: "messages"

setup.template.enabled: "false"
setup.template.name: "filebeat"

2.浏览器查看
filebeat收集Tomcat日志
1.配置filebeat
[root@web01 filebeat]# vim filebeat.yml
filebeat.inputs:
- type: log
enable: true
paths:
- /var/log/tomcat/catalina.*.log
multiline.pattern: '^['
multiline.negate: true
multiline.match: after
output.elasticsearch:
hosts: ["10.0.0.51:9200"]
index: "nginx_%{+YYYY-MM-dd}"
setup.template.enabled: "false"
setup.template.name: "filebeat"
setup.template.pattern: "filebeat-*"
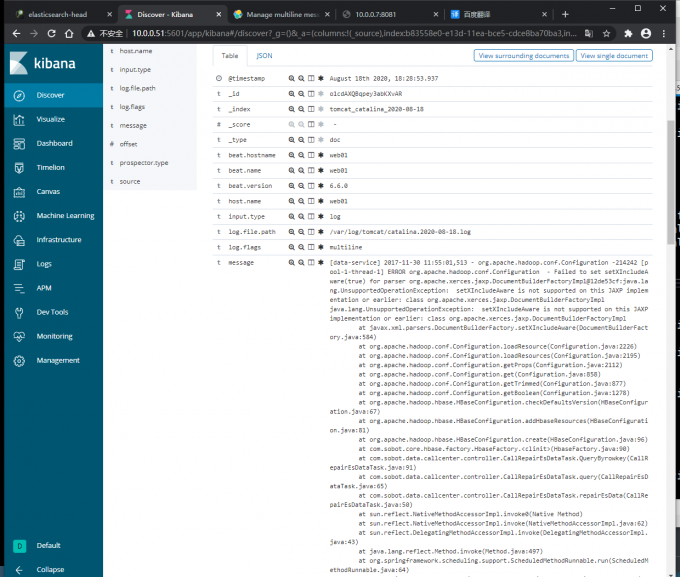
2.kibana查看数据格式如下
kibana出图
1.配置logstash
[root@web01 conf.d]# vim nginx_es.conf
input {
  file {
    path => "/var/log/nginx/access.log"
    start_position => "beginning"
    codec => "json"
  }
}
output {
  elasticsearch {
    hosts => ["10.0.0.51:9200","10.0.0.52:9200"]
    index => "nginx_es_%{+YYYY-MM-dd}.log"
  }
}
启动
[root@web01 conf.d]# logstash -f nginx_es.conf
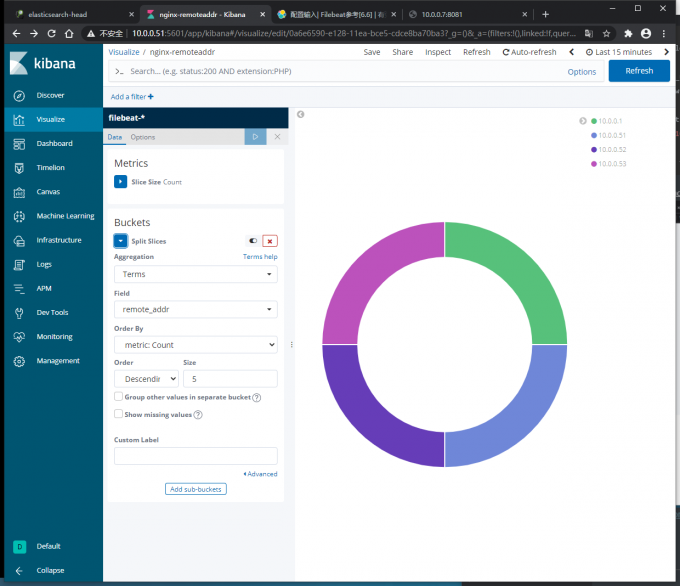
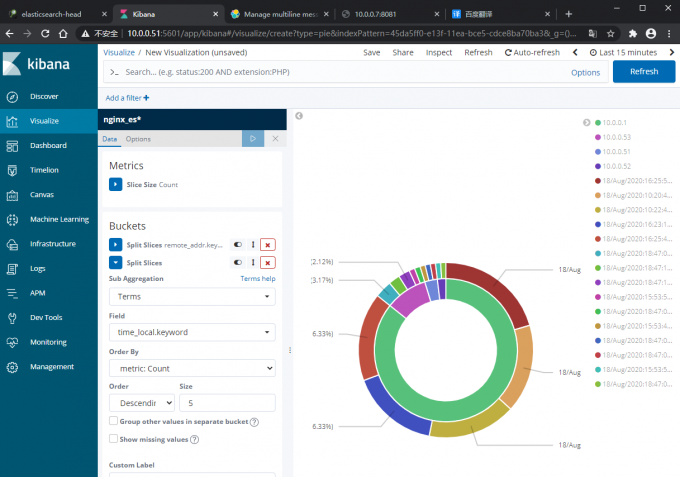
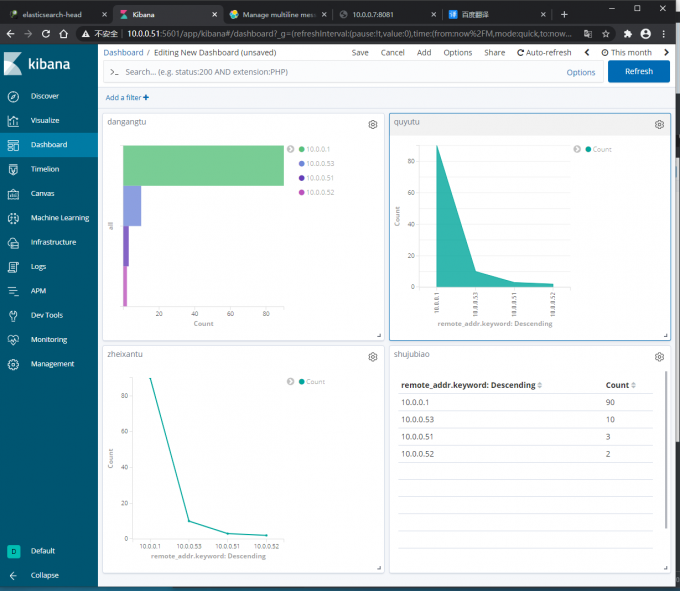
饼图
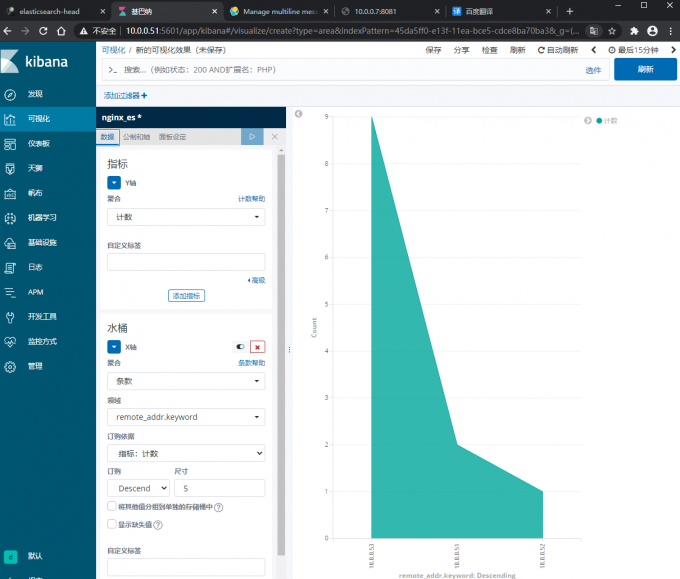
区域图
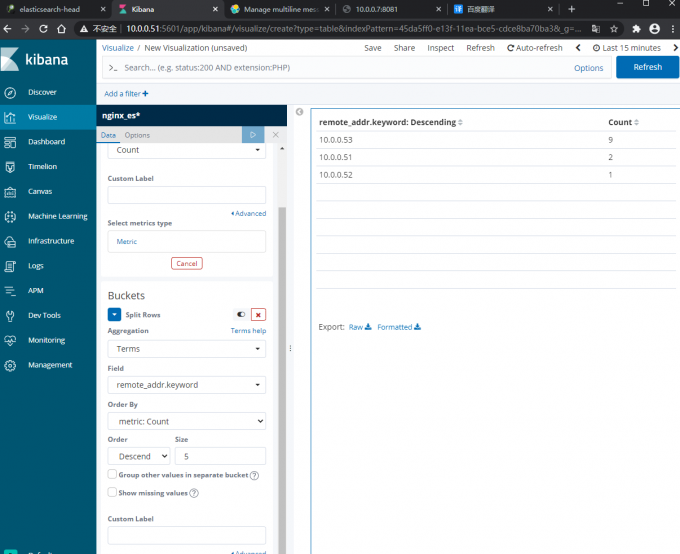
数据表
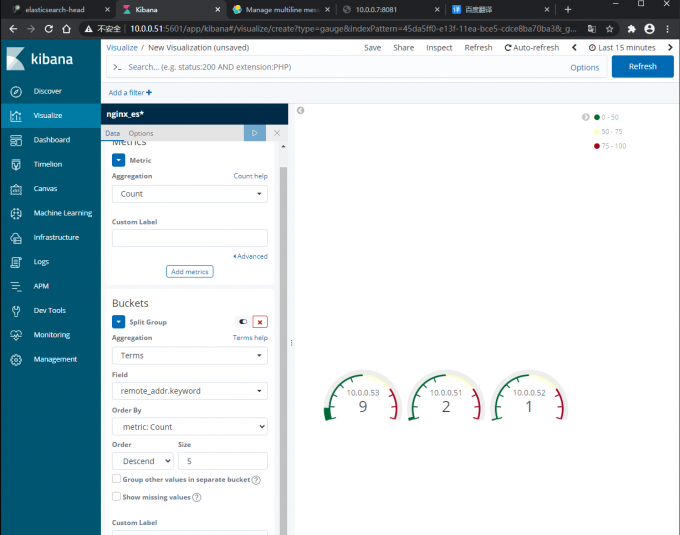
测量图
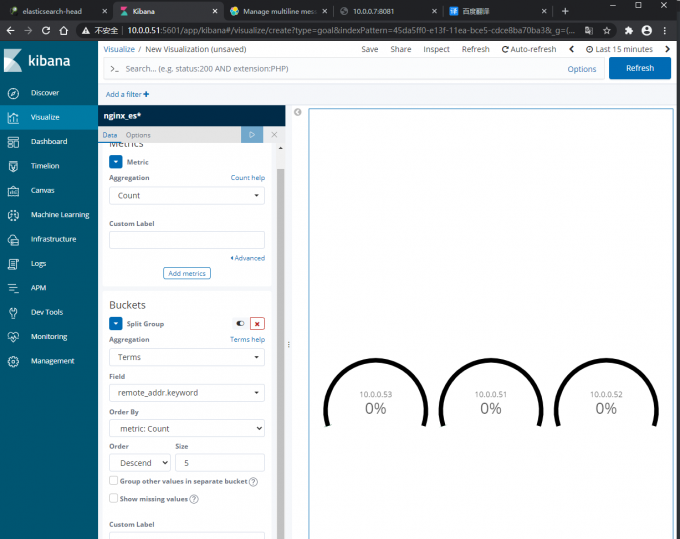
目标图
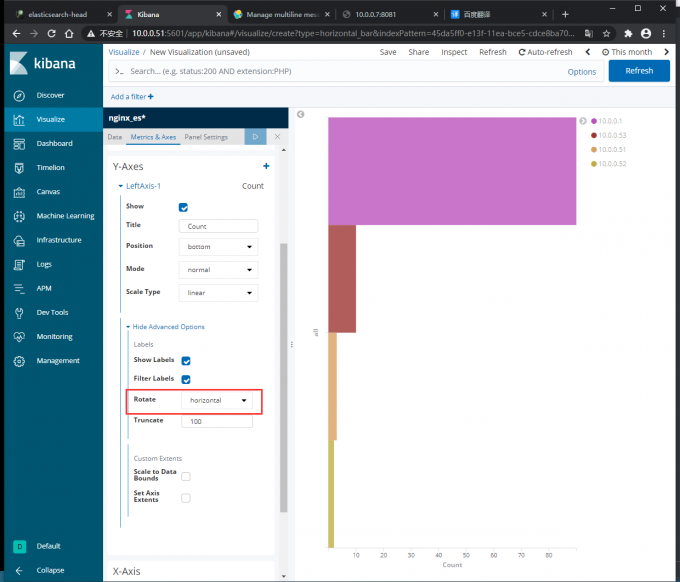
单杠图
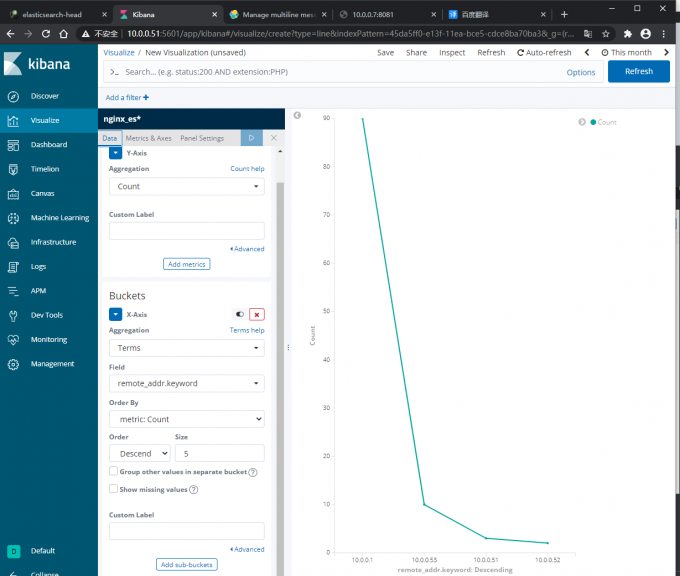
折线图
标签图
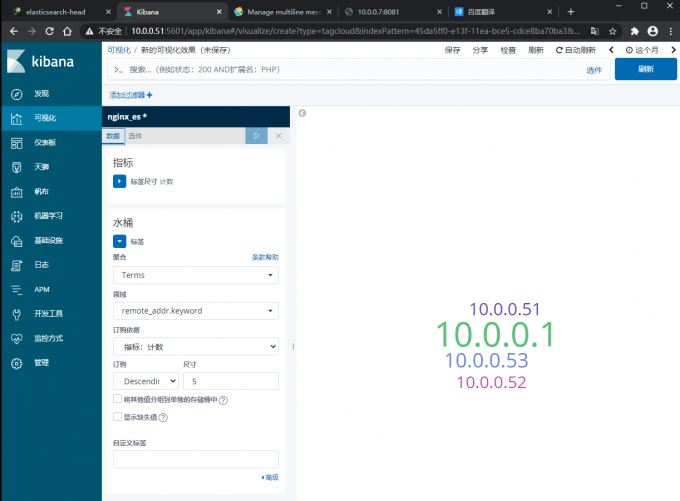
数据图集中展示
使用地图统计地区ip
1.安装geoip
[root@web01 conf.d]# rz ingest-geoip-6.6.0.zip
[root@db01 logstash]# unzip ingest-geoip-6.6.0.zip
[root@db01 logstash]# cd config/
[root@db01 config]# ll
total 65816
-rw-rw-r-- 1 root root  6173457 Jan 24  2019 GeoLite2-ASN.mmdb
-rw-rw-r-- 1 root root 57784030 Jan 24  2019 GeoLite2-City.mmdb
-rw-rw-r-- 1 root root  3428908 Jan 24  2019 GeoLite2-Country.mmdb
2.编辑
[root@db01 config]# vim geoip.conf

3.启动logstash
[root@db01 config]# logstash -f geoip.conf
使用地图统计地区IP
1.安装geoip
[root@web01 logstash]# rz ingest-geoip-6.6.0.zip
[root@web01 logstash]# unzip ingest-geoip-6.6.0.zip

#下载地址
Logstash2版本下载地址:http://geolite.maxmind.com/download/geoip/database/GeoLiteCity.dat.gz
logstash5版本下载地址:http://geolite.maxmind.com/download/geoip/database/GeoLite2-City.tar.gz
2.配置
[root@web01 logstash]# cat conf.d/geoip.conf
input {
  file {
    path => "/var/log/nginx/access.log"
    type => "nginx_access_log"
    start_position => "end"
    codec => "json"
  }
}

filter {
  json {
    source => "message"
    remove_field => ["message"]
  }
  geoip {
    source => "clientip"
    target => "geoip"
    database => "/etc/logstash/config/GeoLite2-City.mmdb"
    add_field => [ "[geoip][coordinates]", "%{[geoip][longitude]}" ]
    add_field => [ "[geoip][coordinates]", "%{[geoip][latitude]}"  ]
  }
  mutate {
    convert => [ "[geoip][coordinates]", "float"]
  }
}

output {
  elasticsearch {
    hosts => ["10.0.0.51:9200"]
    index => "logstash-%{type}-%{+YYYY.MM.dd}"
  }
}
3.启动
[root@web01 logstash]# logstash -f conf.d/geoip.conf
4.插入数据
#北京公网IP
[root@elkstack03 conf.d]# echo '{"@timestamp":"2019-04-11T20:27:25+08:00","host":"222.28.0.112","clientip":"222.28.0.112","size":0,"responsetime":0.000,"upstreamtime":"-","upstreamhost":"-","http_host":"www.elk.com","url":"/index.html","domain":"www.elk.com","xff":"10.0.0.1","referer":"-","status":"304"}' >> /usr/local/nginx/logs/access_json.log

#海南公网IP
[root@elkstack03 conf.d]# echo '{"@timestamp":"2019-04-11T20:40:24+08:00","host":" 124.225.0.13","clientip":"124.225.0.13","size":0,"responsetime":0.000,"upstreamtime":"-","upstreamhost":"-","http_host":"www.elk.com","url":"/index.html","domain":"www.elk.com","xff":"10.0.0.1","referer":"-","status":"304"}' >> /usr/local/nginx/logs/access_json.log

#吉林公网IP
[root@elkstack03 conf.d]# echo '{"@timestamp":"2019-04-11T20:45:24+08:00","host":" 124.234.0.12","clientip":"124.234.0.12","size":0,"responsetime":0.000,"upstreamtime":"-","upstreamhost":"-","http_host":"www.elk.com","url":"/index.html","domain":"www.elk.com","xff":"10.0.0.1","referer":"-","status":"304"}' >> /usr/local/nginx/logs/access_json.log

#黑龙江公网IP
[root@elkstack03 conf.d]# echo '{"@timestamp":"2019-04-11T20:46:24+08:00","host":" 123.164.0.18","clientip":"123.164.0.18","size":0,"responsetime":0.000,"upstreamtime":"-","upstreamhost":"-","http_host":"www.elk.com","url":"/index.html","domain":"www.elk.com","xff":"10.0.0.1","referer":"-","status":"304"}' >> /usr/local/nginx/logs/access_json.log