【简介】
GoJS是一个可视化JavaScript库,用于浏览器中创建交互图形,(比如流程图,树图,关系图,力导图等等)。
GoJS不依赖于任何JS库或框架(例如bootstrap、jquery等),可与任何HTML或JS框架配合工作,甚至可以不用框架。GoJS依赖于HTML5,所以请保证您的浏览器版本支持HTML5,当然还要加载这个库。
【API系统化学习】
一、有个sf文章系统化的整理了常用的api学习。
GoJS 绘图 (四) :构建节点与GraphObjects
二、官网的入门教程-中文翻译
可参照【https://liuxiaofan.com/2018/03/16/3521.html】
三、去除水印
在go.js找到:"7eba17a4ca3b1a8346" 找到这个关键字,
将: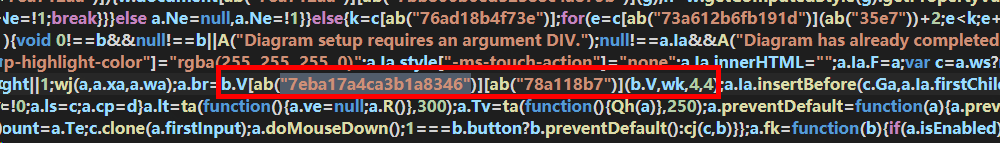
改成:a.br=function(){return true}即可。
四、箭头的类型
官网option【https://gojs.net/latest/samples/arrowheads.html】
常用的是:
$(go.Shape, // 箭头
{ toArrow: "Standard", stroke: null }),
或者
toArrow: Triangle; fromArrow: BackwardTriangle
【流程图可编辑功能-示例】
效果图截图如下:
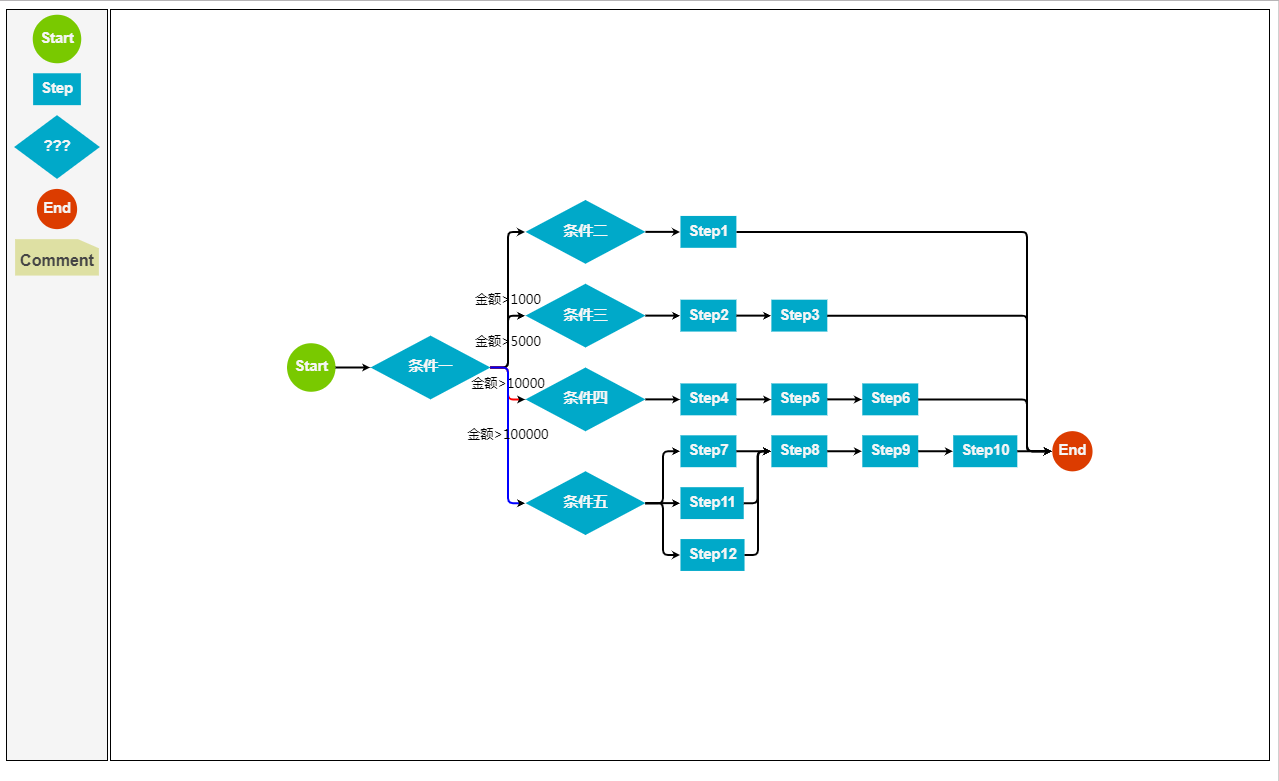
index.html代码如下:
<!DOCTYPE html>
<html>
<head>
<meta charset="UTF-8">
<title>流程图demo 可实现编辑,线条状态动态更新</title>
<meta name="description" content="Interactive flowchart diagram implemented by GoJS in JavaScript for HTML." />
<meta name="viewport" content="width=device-width, initial-scale=1">
<!-- Copyright 1998-2019 by Northwoods Software Corporation. -->
<script src="./js/go.js"></script>
<body>
<!-- 这个DIV必须指定宽高,否者不会被渲染出来
我们通常为DIV设置一个背景颜色以便于我们更便捷的观察 -->
<div id="sample">
<div style=" 100%; display: flex; justify-content: space-between">
<div id="myPaletteDiv" style=" 100px; margin-right: 2px; background-color: whitesmoke; border: solid 1px black"></div>
<div id="myDiagramDiv" style="flex-grow: 1; height: 750px; border: solid 1px black"></div>
</div>
</div>
<script type="text/javascript">
var $ = go.GraphObject.make;
var myDiagram = $(go.Diagram, "myDiagramDiv",
{
initialContentAlignment: go.Spot.Center,
//居中显示Diagram内容
"undoManager.isEnabled": true,
//打开ctrl-z撤销和ctrl-y重做功能
layout: $(go.TreeLayout,
{angle: 0, layerSpacing: 35})
//1个特殊的树形排列Diagram.layout布局
});
function nodeStyle() {
return [
// The Node.location comes from the "loc" property of the node data,
// converted by the Point.parse static method.
// If the Node.location is changed, it updates the "loc" property of the node data,
// converting back using the Point.stringify static method.
new go.Binding("location", "loc", go.Point.parse).makeTwoWay(go.Point.stringify),
{
// the Node.location is at the center of each node
locationSpot: go.Spot.Center
}
];
}
function textStyle() {
return {
font: "bold 11pt Helvetica, Arial, sans-serif",
stroke: "whitesmoke"
}
}
// Define a function for creating a "port" that is normally transparent.
// The "name" is used as the GraphObject.portId,
// the "align" is used to determine where to position the port relative to the body of the node,
// the "spot" is used to control how links connect with the port and whether the port
// stretches along the side of the node,
// and the boolean "output" and "input" arguments control whether the user can draw links from or to the port.
function makePort(name, align, spot, output, input) {
var horizontal = align.equals(go.Spot.Top) || align.equals(go.Spot.Bottom);
// the port is basically just a transparent rectangle that stretches along the side of the node,
// and becomes colored when the mouse passes over it
return $(go.Shape,
{
fill: "transparent", // changed to a color in the mouseEnter event handler
strokeWidth: 0, // no stroke
horizontal ? NaN : 8, // if not stretching horizontally, just 8 wide
height: !horizontal ? NaN : 8, // if not stretching vertically, just 8 tall
alignment: align, // align the port on the main Shape
stretch: (horizontal ? go.GraphObject.Horizontal : go.GraphObject.Vertical),
portId: name, // declare this object to be a "port"
fromSpot: spot, // declare where links may connect at this port
fromLinkable: output, // declare whether the user may draw links from here
toSpot: spot, // declare where links may connect at this port
toLinkable: input, // declare whether the user may draw links to here
cursor: "pointer", // show a different cursor to indicate potential link point
mouseEnter: function(e, port) { // the PORT argument will be this Shape
if (!e.diagram.isReadOnly) port.fill = "rgba(255,0,255,0.5)";
},
mouseLeave: function(e, port) {
port.fill = "transparent";
}
});
}
myDiagram.nodeTemplateMap.add("", // the default category
$(go.Node, "Table", nodeStyle(),
// the main object is a Panel that surrounds a TextBlock with a rectangular Shape
$(go.Panel, "Auto",
$(go.Shape, "Rectangle",
{ fill: "#00A9C9", strokeWidth: 0 },
new go.Binding("figure", "figure")),
$(go.TextBlock, textStyle(),
{
margin: 8,
maxSize: new go.Size(160, NaN),
wrap: go.TextBlock.WrapFit,
editable: true
},
new go.Binding("text").makeTwoWay())
),
// four named ports, one on each side:
makePort("T", go.Spot.Top, go.Spot.TopSide, false, true),
makePort("L", go.Spot.Left, go.Spot.LeftSide, true, true),
makePort("R", go.Spot.Right, go.Spot.RightSide, true, true),
makePort("B", go.Spot.Bottom, go.Spot.BottomSide, true, false)
)
);
myDiagram.nodeTemplateMap.add("Start",
$(go.Node, "Table", nodeStyle(),
$(go.Panel, "Auto",
$(go.Shape, "Circle",
{ minSize: new go.Size(40, 40), fill: "#79C900", strokeWidth: 0 }),
$(go.TextBlock, "Start", textStyle(),
new go.Binding("text"))
),
// three named ports, one on each side except the top, all output only:
makePort("L", go.Spot.Left, go.Spot.Left, true, false),
makePort("R", go.Spot.Right, go.Spot.Right, true, false),
makePort("B", go.Spot.Bottom, go.Spot.Bottom, true, false)
)
);
myDiagram.nodeTemplateMap.add("Conditional",
$(go.Node, "Table", nodeStyle(),
// the main object is a Panel that surrounds a TextBlock with a rectangular Shape
$(go.Panel, "Auto",
$(go.Shape, "Diamond",
{ fill: "#00A9C9", strokeWidth: 0 },
new go.Binding("figure", "figure")),
$(go.TextBlock, textStyle(),
{
margin: 8,
maxSize: new go.Size(160, NaN),
wrap: go.TextBlock.WrapFit,
editable: true
},
new go.Binding("text").makeTwoWay())
),
// four named ports, one on each side:
makePort("T", go.Spot.Top, go.Spot.Top, false, true),
makePort("L", go.Spot.Left, go.Spot.Left, true, true),
makePort("R", go.Spot.Right, go.Spot.Right, true, true),
makePort("B", go.Spot.Bottom, go.Spot.Bottom, true, false)
)
);
myDiagram.nodeTemplateMap.add("End",
$(go.Node, "Table", nodeStyle(),
$(go.Panel, "Auto",
$(go.Shape, "Circle",
{ minSize: new go.Size(40, 40), fill: "#DC3C00", strokeWidth: 0 }),
$(go.TextBlock, "End", textStyle(),
new go.Binding("text"))
),
// three named ports, one on each side except the bottom, all input only:
makePort("T", go.Spot.Top, go.Spot.Top, false, true),
makePort("L", go.Spot.Left, go.Spot.Left, false, true),
makePort("R", go.Spot.Right, go.Spot.Right, false, true)
)
);
// taken from ../extensions/Figures.js:
go.Shape.defineFigureGenerator("File", function(shape, w, h) {
var geo = new go.Geometry();
var fig = new go.PathFigure(0, 0, true); // starting point
geo.add(fig);
fig.add(new go.PathSegment(go.PathSegment.Line, .75 * w, 0));
fig.add(new go.PathSegment(go.PathSegment.Line, w, .25 * h));
fig.add(new go.PathSegment(go.PathSegment.Line, w, h));
fig.add(new go.PathSegment(go.PathSegment.Line, 0, h).close());
var fig2 = new go.PathFigure(.75 * w, 0, false);
geo.add(fig2);
// The Fold
fig2.add(new go.PathSegment(go.PathSegment.Line, .75 * w, .25 * h));
fig2.add(new go.PathSegment(go.PathSegment.Line, w, .25 * h));
geo.spot1 = new go.Spot(0, .25);
geo.spot2 = go.Spot.BottomRight;
return geo;
});
myDiagram.nodeTemplateMap.add("Comment",
$(go.Node, "Auto", nodeStyle(),
$(go.Shape, "File",
{ fill: "#DEE0A3", strokeWidth: 0 }),
$(go.TextBlock, textStyle(),
{
margin: 5,
maxSize: new go.Size(200, NaN),
wrap: go.TextBlock.WrapFit,
textAlign: "center",
editable: true,
font: "bold 12pt Helvetica, Arial, sans-serif",
stroke: '#454545'
},
new go.Binding("text").makeTwoWay())
// no ports, because no links are allowed to connect with a comment
)
);
//连接线装饰模板
var linkSelectionAdornmentTemplate =
$(go.Adornment, "Link",
$(go.Shape,
// 声明此形状共享链接。
{ isPanelMain: true, fill: null, stroke: "deepskyblue", strokeWidth: 0 })
// 使用选择对象的频宽
);
myDiagram.linkTemplate =
$(go.Link, // 整个链路面板
{ selectable: true, selectionAdornmentTemplate: linkSelectionAdornmentTemplate },
{ relinkableFrom: true, relinkableTo: true, reshapable: true },
{
routing: go.Link.AvoidsNodes,
curve: go.Link.JumpOver,
corner: 5,
toShortLength: 4
},
new go.Binding("points").makeTwoWay(),
$(go.Shape, // 链路路径形状
new go.Binding('stroke', 'color'),//这个是表示连续箭头的颜色,在linkDataArray中设置color属性
{ isPanelMain: true, strokeWidth: 2 }), //设置连线的颜色stroke: "red"
$(go.Shape, // 箭头
{ toArrow: "Standard", stroke: null }),
$(go.Panel, "Auto",
new go.Binding("visible", "isSelected").ofObject(),
$(go.Shape, "RoundedRectangle", // 连杆形状 左边的圆角矩形
{ fill: "#F8F8F8", stroke: null }),
$(go.TextBlock,
{
textAlign: "center",
font: "10pt helvetica, arial, sans-serif",
stroke: "#919191",
margin: 2,
minSize: new go.Size(10, NaN),
editable: true
},
new go.Binding("text").makeTwoWay())
),
$(go.TextBlock,new go.Binding('text', 'text'))
//这个表示linkDataArray中属性为text的值,即使连线上的文字
);
// initialize the Palette that is on the left side of the page
myPalette =
$(go.Palette, "myPaletteDiv", // must name or refer to the DIV HTML element
{
nodeTemplateMap: myDiagram.nodeTemplateMap, // share the templates used by myDiagram
model: new go.GraphLinksModel([ // specify the contents of the Palette
{ category: "Start", text: "Start" },
{ text: "Step" },
{ category: "Conditional", text: "???" },
{ category: "End", text: "End" },
{ category: "Comment", text: "Comment" }
])
});
//数据一起定义,并渲染
var jsond ={ "class": "go.GraphLinksModel",
"linkFromPortIdProperty": "fromPort",
"linkToPortIdProperty": "toPort",
"modelData": {"position":"0 0"},
"nodeDataArray": [
{"text":"Start", "category":"Start", "fill":"#00AD5F", "key":-1, "loc":"-500 100"},
{"text":"条件一", "category":"Conditional", "fill":"lightskyblue", "key":-4, "loc":"-500 100"},
{"text":"End", "category":"End", "fill":"#CE0620", "key":-5, "loc":"1300 50"},
{"text":"条件二", "category":"Conditional", "fill":"red", "key":-6, "loc":"300 -150"},
{"text":"条件三", "category":"Conditional", "fill":"lightskyblue", "key":-7, "loc":"300 -50"},
{"text":"条件四", "category":"Conditional", "fill":"lightskyblue", "key":-8, "loc":"300 50"},
{"text":"条件五", "category":"Conditional", "fill":"lightskyblue", "key":-9, "loc":"300 150"},
{"text":"Step1", "key":-2, "loc":"500 -150"},
{"text":"Step2", "key":-10, "loc":"500 -50"},
{"text":"Step4", "key":-11, "loc":"500 50"},
{"text":"Step3", "key":-12, "loc":"700 -50"},
{"text":"Step5", "key":-13, "loc":"700 50"},
{"text":"Step6", "key":-14, "loc":"900 50"},
{"text":"Step7", "key":-15, "loc":"500 150"},
{"text":"Step8", "key":-16, "loc":"700 150"},
{"text":"Step9", "key":-17, "loc":"900 150"},
{"text":"Step10", "key":-18, "loc":"1100 150"},
{"text":"Step11", "key":-19, "loc":"500 100"},
{"text":"Step12", "key":-20, "loc":"500 200"}
],
"linkDataArray": [
{"from":-4, "to":-6, "category":"auditedLineColor","text":"金额>1000"},
{"from":-4, "to":-7, "category":"auditingLineColor","text":"金额>5000"},
{"from":-4, "to":-8 ,"text":"金额>10000","color":"red"},
{"from":-4, "to":-9,"text":"金额>100000","color":"blue"},
{"from":-1, "to":-4},
{"from":-6, "to":-2},
{"from":-2, "to":-5},
{"from":-7, "to":-10},
{"from":-10, "to":-12},
{"from":-12, "to":-5},
{"from":-8, "to":-11},
{"from":-11, "to":-13},
{"from":-13, "to":-14},
{"from":-14, "to":-5},
{"from":-9, "to":-15},
{"from":-15, "to":-16},
{"from":-16, "to":-17},
{"from":-17, "to":-18},
{"from":-18, "to":-5},
{"from":-9, "to":-19},
{"from":-9, "to":-20},
{"from":-19, "to":-16},
{"from":-20, "to":-16}
]};
myDiagram.model = go.GraphLinksModel.fromJson(jsond);
</script>
</body>
</html>