本周准备一个分享,顺便记录一下入门时碰到的问题。
官方文档:https://echarts.apache.org/zh/index.html
0.关于Echarts
ECharts.js是百度开源的一个数据可视化图表库。
2018年,全球著名开源社区 Apache 基金会宣布“百度开源的 ECharts 项目全票通过进入 Apache 孵化器”。这是百度第一个进入国际顶级开源社区的项目。

1.安装
npm install echarts --save
2.引入
// 全部引入
const echarts = require('echarts')

// 按需引入
// 引入 ECharts 主模块
var echarts = require('echarts/lib/echarts');
// 引入柱状图
require('echarts/lib/chart/bar');
// 引入提示框和标题组件
require('echarts/lib/component/tooltip');
require('echarts/lib/component/title');
3.使用
笔者搭配vue使用echarts,以下代码均包含vue.js相关代码。
3.1 初始化
echarts的初始化使用很简单,引入的echarts主模块里,可以调用init()初始话函数,给这个函数传入dom元素,再根据自己需要进行设置setOption即可。
<div id='test'/>
需要注意的是,你需要提前给定这个元素的宽高,特别是高度height,否则在初始化成功之后你会看不到它。
3.2 数据获取与更新
echarts支持异步加载和更新数据,同样只需要将新的数据传入setOption即可。
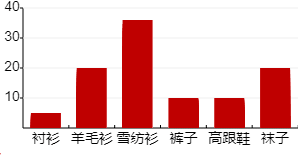
/**
  option: any = {
    title: {
      text: '柱状图'
    },
    tooltip: {},
    xAxis: {
      data: ['衬衫', '羊毛衫', '雪纺衫', '裤子', '高跟鞋', '袜子']
    },
    yAxis: {},
    series: [{
      name: '销量',
      type: 'bar',
      data: []
    }]
  }
*/

    initEchatrs() {
    this.ele = echarts.init(document.getElementById('test'))
    this.ele.setOption(this.option)
    this.ele.showLoading()
    window.onresize = this.ele.resize  // 随窗口尺寸变化调整自身尺寸

    this.getAsyncData()
  }

  getAsyncData() {
    setTimeout(() => {
      // 此处修改对象属性值,有些类似于能让watch监听到的变化才能生效
      // 直接对this.option.xx进行增删改是无法生效的,使用this.$set或者object.assign()
      this.$set(this.option, 'series', [{
        name: '销量',
        type: 'bar',
        data: [5, 20, 36, 10, 10, 20]
      }])
      this.ele.setOption(this.option)
      this.ele.hideLoading()
    }, 1500)
3.3 事件和行为
echarts中绑定事件通过on方法
myChart.on('click', function (params) {
    // 控制台打印数据的名称
    console.log(params.name);
});
echarts里的事件类型包括鼠标事件和使用可以交互的组件(如缩放数据区域等)后触发的行为事件。
它支持常规的鼠标事件类型,包括click、dbclick、mousedown、mousemove、mouseup、mouseover、mouseout等,将对应的事件名传入on方法即可,回调事件包含参数params,它包含一个点击图形的数据信息的对象
{
    // 当前点击的图形元素所属的组件名称,
    // 其值如 'series'、'markLine'、'markPoint'、'timeLine' 等。
    componentType: string,
    // 系列类型。值可能为:'line'、'bar'、'pie' 等。当 componentType 为 'series' 时有意义。
    seriesType: string,
    // 系列在传入的 option.series 中的 index。当 componentType 为 'series' 时有意义。
    seriesIndex: number,
    // 系列名称。当 componentType 为 'series' 时有意义。
    seriesName: string,
    // 数据名,类目名
    name: string,
    // 数据在传入的 data 数组中的 index
    dataIndex: number,
    // 传入的原始数据项
    data: Object,
    // sankey、graph 等图表同时含有 nodeData 和 edgeData 两种 data,
    // dataType 的值会是 'node' 或者 'edge',表示当前点击在 node 还是 edge 上。
    // 其他大部分图表中只有一种 data,dataType 无意义。
    dataType: string,
    // 传入的数据值
    value: number|Array
    // 数据图形的颜色。当 componentType 为 'series' 时有意义。
    color: string
}
on事件还支持query,query可以只对指定的图形元素触发回调。
chart.on(eventName, query, handler);
query可以为字符串
chart.on('click', 'series', function () {...});
chart.on('click', 'series.line', function () {...});
chart.on('click', 'dataZoom', function () {...});
chart.on('click', 'xAxis.category', function () {...});
也可以为对象object,它包含以下可选属性
{
    <mainType>Index: number // 组件 index
    <mainType>Name: string // 组件 name
    <mainType>Id: string // 组件 id
    dataIndex: number // 数据项 index
    name: string // 数据项 name
    dataType: string // 数据项 type,如关系图中的 'node', 'edge'
    element: string // 自定义系列中的 el 的 name
}
如
chart.setOption({
    // ...
    series: [{
        name: 'uuu'
        // ...
    }]
});
chart.on('mouseover', {seriesName: 'uuu'}, function () {
    // series name 为 'uuu' 的系列中的图形元素被 'mouseover' 时,此方法被回调。
});
其他支持的组件交互行为都会触发对应的事件,在官方文档中均有说明
3.4 绘制svg
echarts最开始是使用canvas绘制图表的,目前echarts 4.0以上已经支持svg绘制。
只需要在init中的参数中设置render参数即可。
// init: Function
(dom: HTMLDivElement|HTMLCanvasElement, theme?: Object|string, opts?: {
    devicePixelRatio?: number,
    renderer?: string,
    width?: number|string,
    height?: number|string
}) => ECharts

// dom: 实例的容器,一般是一个具有宽高的div元素
// theme: 应用主题
// opts: 附加参数,可选项有:
//                         devicePixelRatio: 设备像素比,默认取浏览器的window.devicePixelRatio
//                         renderer: 渲染器,可选'canvas'或者'svg'
//                          实例宽度,px
//                         height: 实例高度,px
3.5 其他api
echarts的api文档写的十分详尽,参考它的官方文档,使用你想使用的组件即可。
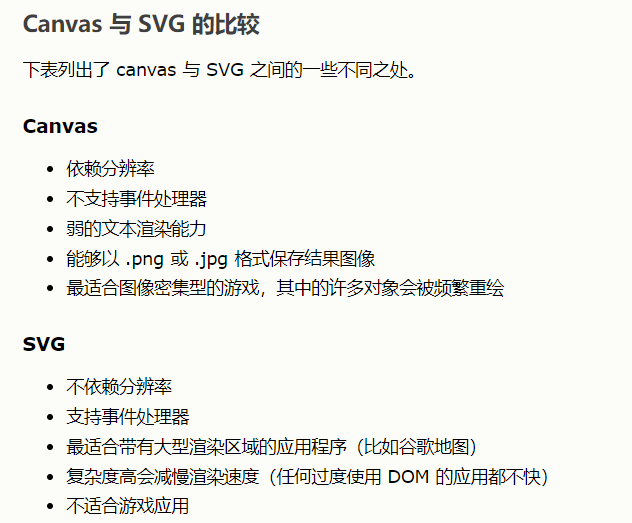
4.canvas
canvas与svg都是浏览器端绘制图形的手段,但是他们在根本上是不同的。仅在绘图方面,svg的优势在于不会失真,渲染性能略高(因此更适合移动端)、内存占用更低;canvas更适合绘制图形元素数量非常大的图表。
echarts的根本是对canvas/svg的操作,它的底层使用了zRender来绘制。
echarts的github:https://github.com/apache/incubator-echarts
这里仅讨论canvas。
<canvas>标签提供了一块空白的画布容器,它公开了一个或多个渲染上下文,需要通过脚本在上面绘制。使用原生的canvas绘制图形,需要对canvas的api使用熟练。
canvas api:https://www.runoob.com/tags/ref-canvas.html
具体代码可以参考后面,先记录一下实际中踩到的几个坑:
4.1 绘制1px线
参考:https://www.cnblogs.com/v-rockyli/p/3833845.html
下面两张图分别是处理前和处理后的效果

处理后
处理前
仔细观察可以发现下图坐标轴和对齐轴的线条,比起上图看起来要粗一些、颜色浅一些。实际上两张图内绘制的线条都是1px。为什么会有这种区别呢?
这跟canvas的绘制逻辑有关,当我们试图绘制一个线段时,canvas会读取lineWidth,,然后尝试将在坐标处两边各绘制一半的lineWidth。
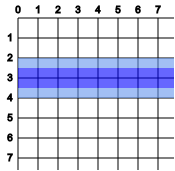
比如我们想在坐标(0,3)处绘制一条横线,canvas会以3为中轴线,在两边各画0.5像素,深蓝色就是我们期望的效果(2.5-3.5,1个像素),但实际上,浅蓝色也会被绘制出来,因为canvas无法在整个像素宽内只绘制半个像素,所以坐标轴上下两个方向都都会被扩展至整个像素宽度内(2-4,两个像素),但是扩展的像素实际的值并不是原值相同,而是取其一半,所以最直接的视觉感受是:线条比预想的变宽了,但是颜色浅了很多。
还是以宽为1的横线为例,我们如果将其绘制在纵坐标2.5处,即以半像素作为中轴线
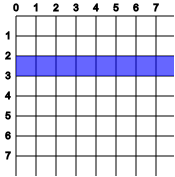
同样浏览器进行绘制时,在2.5上下各绘制0.5的像素宽度,但与上面的例子不同的是,图像边界正好落在整数像素边界内,合起来正好为1个像素,这个时候,就不需要向两边扩展,而是我们预期的的1个像素宽度。
同理,我们分别使用两种方式绘制宽度为2的线段时,效果恰恰相反,在坐标3处绘制的时候,像素正好扩展至2-4,即2个像素,符合我们的预期;而在坐标2.5处绘制时,像素扩展至1.5-3.5,未到边界,需要补足,就变成了1-4,即3个像素。
因此在实际应用中,如果想得到更好的体验,精确的像素值,如果线段的宽度是奇数像素,绘制时以n.5,即半数像素作为中轴线,如果线段的宽度为偶数像素,绘制时以n.0,即整数像素作为中轴线
4.2 视口与画布
视口高度150

视口高度300
可以明显看出效果会按照视口与画布的尺寸进行等比缩放;当视口高度与画布高度1:1的时候,看起来效果是最好。因此指定画布大小的时候,最好也指定canvas视口宽高。
<canvas id="canvas" :width="width" :height="height"></canvas>

 width = 300
 height = 300

#canvas {
   300px;
  height: 300px;
}
但是我们观察echarts的视口与画布大小,可以看出echarts默认视口:画布=2:1,这样做也是有道理的,视口是画布的2倍,可以在缩放到200%的情况下不失真。

因此如果只是想简单实现一个表格,不需要考虑缩放的效果的话,直接指定视口:画布=1:1即可(移动端大多数可以如此);如果需要考虑缩放n倍不失真(比如pc端浏览器的缩放功能),就需要增加视口宽高。
4.3 绘制path
canvas的绘制方法中比较重要的一个手段就是绘制path,其中比较值得注意的是beginPath和closePath。
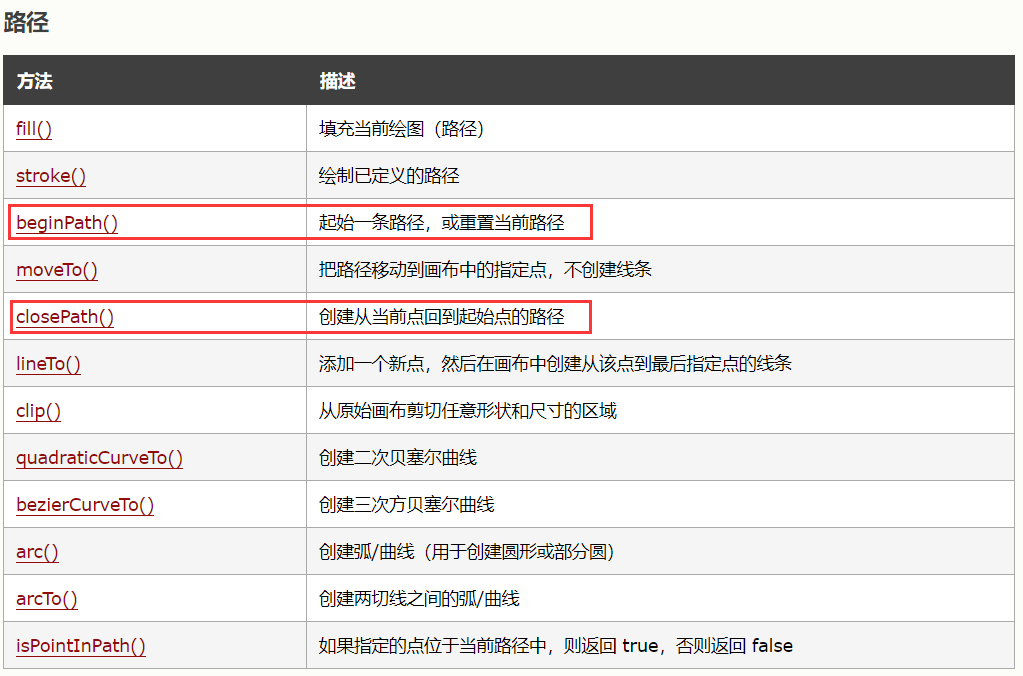
其中个人认为beginPath要比closePath要重要。从api的解释来看,beginPath有“重置当前路径”的功能,closePath只是创建一条新的路径,帮忙把这个图形闭合了而已。
实际操作中不注意begin和close会引起的问题:
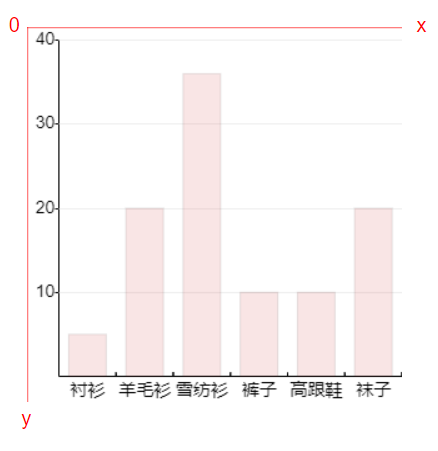
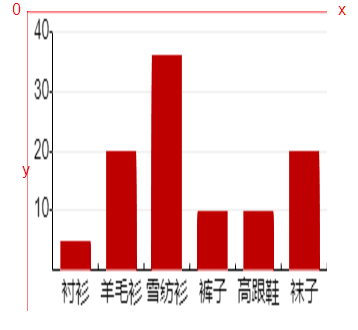
图1 期望效果

图2 无closePath

图3 无beginPath
这里图1的绘制流程可以查看下面代码
  getAsyncData() {
    setTimeout(() => {
      this.yAxis = [5, 20, 36, 10, 10, 20]
      // y坐标轴
      // 计算刻度
      const num = Math.ceil((Math.max(...this.yAxis)) / this.minUnit)
      const yGap = this.yAxisLen / num
      const max = num * this.minUnit

      // 绘制刻度及对齐轴
      for(let i = 0; i < num; i++) {
        const text = this.minUnit * (i + 1) + ''
        // 文本
        this.context.fillText(text, this.x0 - text.length * this.fontsize / 1.5, this.height - (10 + yGap * (i + 1) + this.fontsize / 2))
        // 刻度
        this.context.beginPath()
        const yUnit = Math.floor(this.y0 - this.yAxisLen + yGap * i) + 0.5
        this.context.moveTo(this.x0, yUnit)
        this.context.lineTo(this.x0 - 3, yUnit)
        this.context.strokeStyle = '#000000'
        this.context.stroke()
        // 对齐轴
        this.context.beginPath()
        this.context.moveTo(this.x0, yUnit)
        this.context.lineTo(this.width, yUnit)
        this.context.strokeStyle = '#eeeeee'
        this.context.stroke()
      }

      // 绘制条状图
      const xGap = (this.width - this.x0) / this.xAxis.length
      this.context.fillStyle = this.barColor
      this.barList = []
      this.start = new Array(this.yAxis.length).fill(0)   // 初始化帧数计数数组
      this.yAxis.map((data, index) => {
        const x1 = this.x0 + xGap * (index + 0.5) - this.barWidth / 2
        const h = data / this.minUnit * yGap
        const y1 = this.y0 - h
        const barData = {x: x1, y: y1, w: this.barWidth, h}
        // 保存色块数据
        this.barList.splice(index, 0, Object.assign({}, barData, {
          data,
          index,
          name: this.xAxis[index],
          color: this.barColor
        }))
        // 通过path绘制矩形
        // this.drawRectByPath(x1, y1, this.barWidth, h)
        // 添加动画效果
        this.animate(barData, index)
      })
    }, 1500);
  }

  drawRectByPath(x: number, y: number, w: number, h: number) {
    // 通过路径绘制矩形,x,y为左上角,w为宽,h为高
    // 如果不重置路径(beginPath)那么会从上一次的beginPath开始执行
    this.context.beginPath()
    this.context.moveTo(x, y)
    this.context.lineTo(x + w, y)
    this.context.lineTo(x + w, y + h)
    this.context.lineTo(x, y + h)
    // 如果不closePath,该路径则无法闭合,只会影响描边,不影响填充
    this.context.closePath()
    this.context.strokeStyle = 'rgba(0, 0, 0, 0.1)'
    this.context.fillStyle = 'rgba(200, 0, 0, 0.1)'
    // 未闭合路径也会自动回到开始路径并填充,但是stroke不会
    this.context.stroke()
    this.context.fill()
  }
简单来说是,从上到下绘制刻度轴,从左到右依次绘制条状,path的路径是从左上角开始顺时针连线,颜色是有透明度的。
图1是正常效果,图2是绘制条状时未执行closePath,图3是绘制条状时未执行beginPath。
图2中不执行closePath,可以看出是不影响fill的,对非闭合图形执行fill,会帮你把图形闭合(从最后一点回到起点的一条路径),然后再填充。此处起点为上一次moveTo所在的点。对于stroke,绘制了多少线条就会描边多少线条,并不会自动闭合。
图3中不执行beginPath的影响就大多了,存在两个问题:
1.最左边的条状颜色偏深,越往右越浅
2.最下面的刻度轴压住了除了最右的条状的所有条状(图上看不太出来,因为最右的颜色比较浅)
为什么会这样呢?
自然我们会从beginPath开始入手,beginPath的作用是重置当前路径,如果没有重置路径,那么这次的绘制是从哪里开始的呢?
答案是从上次beginPath之后重新执行。
如果绘制条状的时候没有beginPath,那么绘制过程就会如下:

绘制起点是上一次beginPath的时候,也就是最后一条刻度轴的起点(绿色点)。
绘制第n条的过程是这样的:
1.从绿色点作为第一次起点,绘制一次刻度轴
2.红色点作为第二次起点,绘制一次第一条条状
3.依次绘制第二条、第三条,直到第n条
因此绘制第n条的时候,第一条已经被重复绘制、填充了n次,第二条n-1次,...,以此类推。
所以绘制完成6条,坐标轴被重复绘制了7次,第7次绘制时,盖住了前面绘制的条状,被后续绘制的条状盖住;第一条被重绘了6次,颜色叠加,因此颜色最深;第六条只绘制了1次,颜色最浅
因此使用path的时候一定要注意使用beginPath和closePath。
4.3 实现动画效果
参考:https://m.html.cn/web/javascript/12369.html
实现动画效果实际上是对部分区域的清除和重绘,每秒重绘24帧即可让人看起来这个动作是连续的,因此每秒能实现24帧及以上的重绘,即可实现动画效果。
原理我们知道了,但是如何做到每秒刷新24次及以上,还需要一个函数的支持:window.requestAnimationFrame
对此api的解释可以查看mdn:https://developer.mozilla.org/zh-CN/docs/Web/API/Window/requestAnimationFrame
  animate(to: any, index: number) {
    // 计算此时的y, h
    const h = Math.floor(to.h / this.frames * this.start[index]) + 0.5
    const y = this.y0 - h
    // 清除上一次绘制的矩形
    this.context.clearRect(to.x, y, to.w, h)
    // 重绘矩形
    this.context.fillRect(to.x, y, to.w, h)
    // 变化
    this.start[index]++
    if (this.start[index] <= this.frames) {
      window.requestAnimationFrame(() => this.animate(to, index))
    }
  }
4.4 事件绑定
在开始的canvas与svg的区别中,w3school列出了他们的差异之处,其中提到了canvas是不支持事件处理器的,canvas绘制完成后就成为一整块画布,不再引起浏览器的注意,我们无法对其中某个色块或者线段进行操作。
因此如果想给某个色块添加事件,需要通过坐标的方式判断点击的是哪个色块。
  bindEvents() {
    // 给整个canvas绑定事件
    const canvas = document.getElementById('canvas') as HTMLCanvasElement
    // mousedown
    canvas.addEventListener('mousedown', this.mouseDownEvent.bind(this))
  }

  mouseDownEvent(e: any) {
    // 判断坐标
    const {offsetX, offsetY} = e
    // 对所有色块遍历,判断点击了哪个色块
    this.barList.map((bar, index) => {
      if (this.checkBoundary(offsetX, offsetY, bar.x, bar.y, bar.w, bar.h)) {
        console.log('you click this bar', bar)
      }
    })
  }

  checkBoundary(x0: number, y0: number, x1: number, y1: number, w: number, h: number) {
    // x0, y0为点击的坐标,x1,y1为色块左上角坐标,w,h为色块宽高
    return x0 > x1 && x0 < (x1 + w) && y0 > y1 && y0 < (y1 + h)
  }
如果你的canvas绘制内容比较复杂,还需要考虑色块重叠时的情况。如果还需要做元素的拖拽、缩放、旋转、删除等,可能会更复杂。个人感觉对canvas的事件绑定远不如svg的简单。
---------------------end--------------------
全部代码(vue+ts):
<template>
  <div class="container">
    <span class="zero">0</span>
    <span class="x">x</span>
    <span class="y">y</span>
    <canvas id="canvas" :width="width" :height="height"></canvas>
  </div>
</template>

<script lang="ts">
import { Component, Vue } from 'vue-property-decorator'

@Component
export default class Canvas extends Vue {
  // 视口
  width = 300
  height = 300
  // 字体大小
  fontsize = 14
  // 坐标轴
  minUnit = 10  // y轴最小刻度
  barWidth = 30 // 条状图宽度
  barList: any[] = [] // 条状图色块数据,坐标、宽、高
  barColor = 'rgb(200, 0, 0)'
  xAxis = ['衬衫', '羊毛衫', '雪纺衫', '裤子', '高跟鞋', '袜子']    // x轴数据
  yAxis: number[] = []    // y轴数据
  // 动画
  start: number[] = []
  frames = 30

  // canvas上下文
  context: any

  get x0() {
    // 需要注意canvas的绘制问题
    // canvas绘制时会读取lineWidth,然后尝试在坐标处两边各绘制一般的lineWidth
    // 当lineWidth=1时,canvas会尝试在整数坐标处左右各绘制半个像素
    // 因为canvas无法在一个像素内绘制半个像素,因此坐标处上下两个方向都会被扩展至整个像素宽度内,即两个像素
    // 导致坐标处绘制1像素线条和2像素线条看起来时一样的 只是1像素线条颜色浅了一些
    // 解决办法是在想在n绘制1像素线条时,最好是n.5处绘制
    return 25.5
  }

  get y0() {
    return this.height - 20.5
  }

  get xAxisLen() {
    return this.width - this.x0
  }

  get yAxisLen() {
    return this.y0 - 10.5
  }

  mounted() {
    // canvas创造了一个固定大小的画布,它公开了一个或多个渲染上下文
    // canvas与svg一样 存在视口的概念,不指定canvas标签的宽高属性时, 默认为300*150
    // 在内部样式中指定canvas画布的大小,而不指定视口大小,在实际中会影响到绘制效果
    const canvas: HTMLCanvasElement = document.getElementById('canvas') as HTMLCanvasElement
    // 获取2d上下文,没有这个方法则表示可能不支持canvas
    this.context =  canvas.getContext('2d')

    // 绘制辅助坐标轴
    this.drawSupport()

    // 绘制图表
    this.draw()
  }

  drawSupport() {
    // 开始绘制一段路径,并指定这段路径的样式
    this.context.beginPath()    // 起始一段路径,或重置当前路径
    this.context.moveTo(this.width, 0)
    this.context.lineTo(0, 0)
    this.context.lineTo(0, this.height)
    // this.context.closePath()
    this.context.strokeStyle = "#ff0000"
    this.context.stroke()
  }

  draw() {
    // 绘制坐标轴
    this.context.beginPath()
    this.context.moveTo(this.x0, this.y0 - this.yAxisLen)
    this.context.lineTo(this.x0, this.y0)
    this.context.lineTo(this.width, this.y0)
    // this.context.closePath()
    this.context.strokeStyle = '#000000'
    this.context.stroke()

    // x坐标轴
    this.context.font = `${this.fontsize}px Arial`
    const xGap = (this.width - this.x0) / this.xAxis.length
    this.xAxis.map((text, index) => {
      // 文本
      this.context.fillText(text, this.x0 + xGap * (index + 0.5) - text.length * this.fontsize / 2, this.height - 5)
      // 刻度
      this.context.beginPath()
      this.context.moveTo(this.x0 + xGap * (index + 1), this.y0)
      this.context.lineTo(this.x0 + xGap * (index + 1), this.y0 - 3)
      this.context.closePath()
      this.context.stroke()
    })

    // 模拟异步获取数据
    this.getAsyncData()

    // 绑定事件
    this.bindEvents()
  }

  getAsyncData() {
    setTimeout(() => {
      this.yAxis = [5, 20, 36, 10, 10, 20]
      // y坐标轴
      // 计算刻度
      const num = Math.ceil((Math.max(...this.yAxis)) / this.minUnit)
      const yGap = this.yAxisLen / num
      const max = num * this.minUnit

      // 绘制刻度及对齐轴
      for(let i = 0; i < num; i++) {
        const text = this.minUnit * (i + 1) + ''
        // 文本
        this.context.fillText(text, this.x0 - text.length * this.fontsize / 1.5, this.height - (10 + yGap * (i + 1) + this.fontsize / 2))
        // 刻度
        this.context.beginPath()
        const yUnit = Math.floor(this.y0 - this.yAxisLen + yGap * i) + 0.5
        this.context.moveTo(this.x0, yUnit)
        this.context.lineTo(this.x0 - 3, yUnit)
        this.context.strokeStyle = '#000000'
        this.context.stroke()
        // 对齐轴
        this.context.beginPath()
        this.context.moveTo(this.x0, yUnit)
        this.context.lineTo(this.width, yUnit)
        this.context.strokeStyle = '#eeeeee'
        this.context.stroke()
      }

      // 绘制条状图
      const xGap = (this.width - this.x0) / this.xAxis.length
      this.context.fillStyle = this.barColor
      this.barList = []
      this.start = new Array(this.yAxis.length).fill(0)   // 初始化帧数计数数组
      this.yAxis.map((data, index) => {
        const x1 = this.x0 + xGap * (index + 0.5) - this.barWidth / 2
        const h = data / this.minUnit * yGap
        const y1 = this.y0 - h
        const barData = {x: x1, y: y1, w: this.barWidth, h}
        // 保存色块数据
        this.barList.splice(index, 0, Object.assign({}, barData, {
          data,
          index,
          name: this.xAxis[index],
          color: this.barColor
        }))
        // 通过path绘制矩形
        // this.drawRectByPath(x1, y1, this.barWidth, h)
        // 添加动画效果
        this.animate(barData, index)
      })
    }, 1500);
  }

  animate(to: any, index: number) {
    // 计算此时的y, h
    const h = Math.floor(to.h / this.frames * this.start[index]) + 0.5
    const y = this.y0 - h
    // 清除上一次绘制的矩形
    this.context.clearRect(to.x, y, to.w, h)
    // 重绘矩形
    this.context.fillRect(to.x, y, to.w, h)
    // 变化
    this.start[index]++
    if (this.start[index] <= this.frames) {
      window.requestAnimationFrame(() => this.animate(to, index))
    }
  }

  drawRectByPath(x: number, y: number, w: number, h: number) {
    // 通过路径绘制矩形,x,y为左上角,w为宽,h为高
    // 如果不重置路径(beginPath)那么会从上一次的beginPath开始执行
    this.context.beginPath()
    this.context.moveTo(x, y)
    this.context.lineTo(x + w, y)
    this.context.lineTo(x + w, y + h)
    this.context.lineTo(x, y + h)
    // 如果不closePath,该路径则无法闭合,只会影响描边,不影响填充
    this.context.closePath()
    this.context.strokeStyle = 'rgba(0, 0, 0, 0.1)'
    this.context.fillStyle = 'rgba(200, 0, 0, 0.1)'
    // 未闭合路径也会自动回到开始路径并填充,但是stroke不会
    this.context.stroke()
    this.context.fill()
  }

  bindEvents() {
    // 给整个canvas绑定事件
    const canvas = document.getElementById('canvas') as HTMLCanvasElement
    // mousedown
    canvas.addEventListener('mousedown', this.mouseDownEvent.bind(this))
  }

  mouseDownEvent(e: any) {
    // 判断坐标
    const {offsetX, offsetY} = e
    // 对所有色块遍历,判断点击了哪个色块
    this.barList.map((bar, index) => {
      // todo: 如果图形有重叠,点击重叠区域,如何选中上层元素
      // 引入“层级”概念,为每个图形添加层级属性。越新创建的图形层级越高。
      // 点击重叠区域,直接选中层级高的元素
      // 点击非重叠的图形区域,将该图形的层级提到最高
      if (this.checkBoundary(offsetX, offsetY, bar.x, bar.y, bar.w, bar.h)) {
        console.log('you click this bar', bar)
      }
    })
  }

  checkBoundary(x0: number, y0: number, x1: number, y1: number, w: number, h: number) {
    // x0, y0为点击的坐标,x1,y1为色块左上角坐标,w,h为色块宽高
    return x0 > x1 && x0 < (x1 + w) && y0 > y1 && y0 < (y1 + h)
  }
}
</script>

<style scoped>
.container {
  position: relative;
}
.container span {
  position: absolute;
  color: red;
}
.zero {
  top: -10px;
  left: 15px;
}
.x {
  top: -10px;
  right: 10px;
}
.y {
  top: 100%;
  left: 25px;
}

#canvas {
   300px;
  height: 300px;
}
</style>