Classification is one of the major problems that we solve while working on standard business problems across industries. In this article we’ll be discussing the major three of the many techniques used for the same, Logistic Regression, Decision Trees and Support Vector Machines [SVM].
分类是在实际业务处理中我们所面临的一个主要问题。在这篇文章中我们会讨论多种分类算法中主要的三种算法在相同情况下的表现。分别是逻辑回归(Logistics Regression)、决策树(Decision Trees)、支持向量机(Support Vector Machines,SVM)。
All of the above listed algorithms are used in classification [ SVM and Decision Trees are also used for regression, but we are not discussing that today!]. Time and again I have seen people asking which one to choose for their particular problem. Classical and the most correct but least satisfying response to that question is “it depends!”. Its downright annoying, I agree. So I decided to shed some light on it depends on what.
上述列举的三种算法,在分类问题中都有着广泛的应用(SVM和决策树同时也用于回归问题,但我们这里不做讨论)。我一次又一次的看到人们询问针对他们的问题应该选择哪种分类算法。最经典最正确也最令人不满意的回答是“看情况而定”。我也认为这十分令人讨厌。所以我决定在“看情况而定”方面做出一些分析,给出一些实质性的讨论。
Its a very simplified 2-D explanation and responsibility of extrapolating this understanding to higher dimensional data, painfully lies in the reader’s hand.
???
二维解释这种理解非常简单,并且能够负责地推广这种认识到更高维度的数据。痛苦掌握在读者的手中。
???
I’ll start with discussing the most important question : what exactly are we trying do in classification? well, we are trying to classify.[ Is that a even serious questions? really?]. Let me rephrase that response. In order to classify , we try to get a decision boundary or a curve [ not necessarily straight], which separates two classes in our feature space.
最开始,我会介绍一个最终要的问题,到底我们在分类过程中要做些什么。好吧,我们就是要去做分类。让我换种方式回答。为了做出分类,我们尝试去得到一个决策边界或者曲线(不一定是直线),它能够将我们的特征空间分成两个类别。
Feature space sounds like a very fancy word and confusing to many who haven’t encountered it before. Let me show you an example which will clarify this . I have a sample data with 3 variables; x1, x2 and target. Target takes two values 0 and 1 , depending on values taken by predictor variables x1 and x2. Let me plot this data for you.
特征空间听起来想一个花哨的词,并且成功地搞懵了遇到它的同学们。让我来给你们举一个例子来阐述它。我有一个样本数据由三个变量:x1,x2和类别。类别只能取0、1两个值。根据数据的x1和x2两个变量,我们得到了以下散点图。
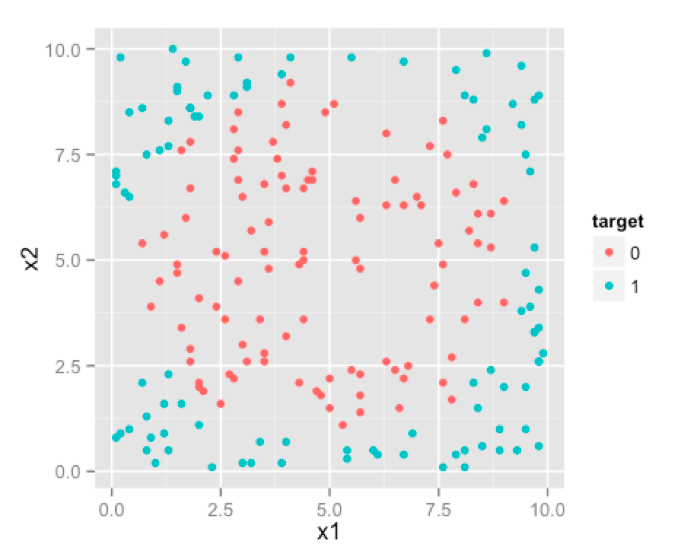
This right here is your feature space. where your observations lie. In this case , since we have only two predictors/features ,feature space is 2D. Here you can see two classes of your target marked by different colors. We would like our algorithm to give us a line/curve which can separate these two classes.
这就是一个依赖于你的观测的特征空间。在这个例子中,我们只有两个特征,所以特征空间是2维的。在这张图中你能看到两种类别的数据点,被涂成了不同的颜色。我们希望我们的算法能够提冲一条曲线来区分这两类点。
We can visually see , that an ideal decision boundary [or separating curve] would be circular. Shape of the produced decision boundary is where the difference lies between Logistic Regression , Decision Tress and SVM.
我们肉眼观测,明白理想的决策分类曲线是一个圆。但是由三种算法得到的分类曲线却是不同的。
Lets start with logistic regression. Many of us are confused about shape of decision boundary given by a logistic regression. This confusion mainly arises because of looking at the famous S-shaped curve too many times in context of logistic regression.
让我们由逻辑回归开始。许多人都会对逻辑回归给出的分类边界很困惑。这种困惑主要由于在有关逻辑回归的文章中多次看到了注明的S型曲线,Sigmoid.
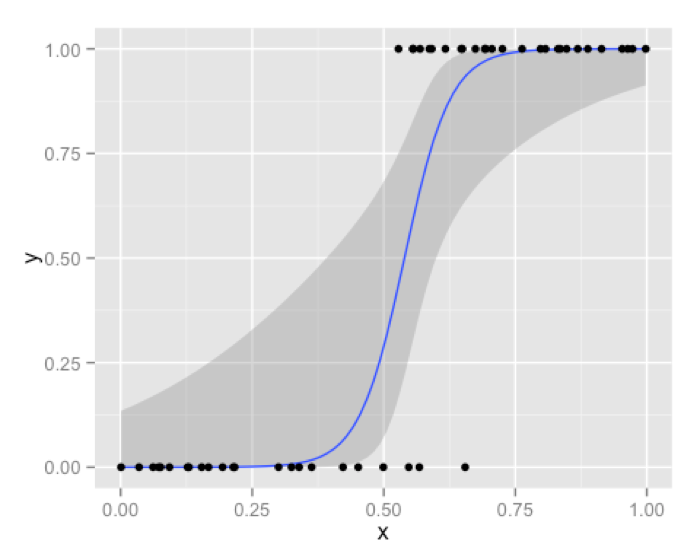
This blue curve that you see is not a decision boundary. Its simply in a way is transformed response from binary response which we model using logistic regression. Decision boundary of logistic regression is always a line [ or a plane , or a hyper-plane for higher dimension]. Best way to convince you will be , by showing the famous logistic regression equation that you are all too familiar with.
这条蓝色的曲线并不是分类边界,仅仅是逻辑回归模型中一种从数据到二值相应的转换方法。逻辑回归的决策边界往往是一条直线、一个平面或者一个超平面。最好的说服你的办法就是展示每个人都非常熟悉的著名的逻辑回归方程。

Let’s assume for simplification, F is nothing but a linear combination of all the predictors .
为了简单起见,我们假设F就是所有维度数据的线性组合。

The above equation can also be written as :
上述方程我们还可以写成:

Now to predict in logistic regression you decide a particular score cutoff for the probabilities, above which your prediction will be 1 or 0 otherwise. Lets say that cutoff is c. so your decision process will be like this :
现在为了在逻辑回归中作出预测,我们定下一个特定的概率阈值,大于这个阈值预测值为1,否则为0.最后我们讨论下截距c。所以你的分类过程变成了如下:
Y=1 if p>c , otherwise 0. Which eventually gives the decision boundary F > constant.
如果p>c,Y为1,否则为0。最终给出的分类曲线为F> 常数。
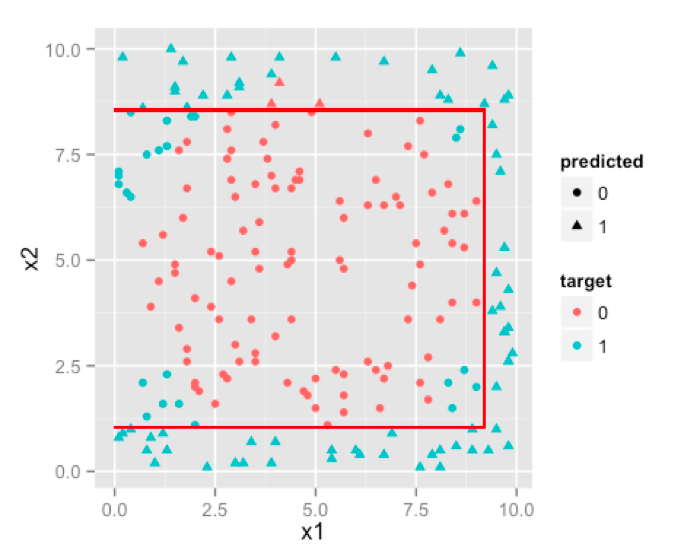
F>constant, here is nothing but a linear decision boundary . Result of logistic regression for our sample data will be like this.
F> 常数仅仅表示了一个线性的分类曲线。逻辑回归在我们的样本数据上的结果最终表现成这样。
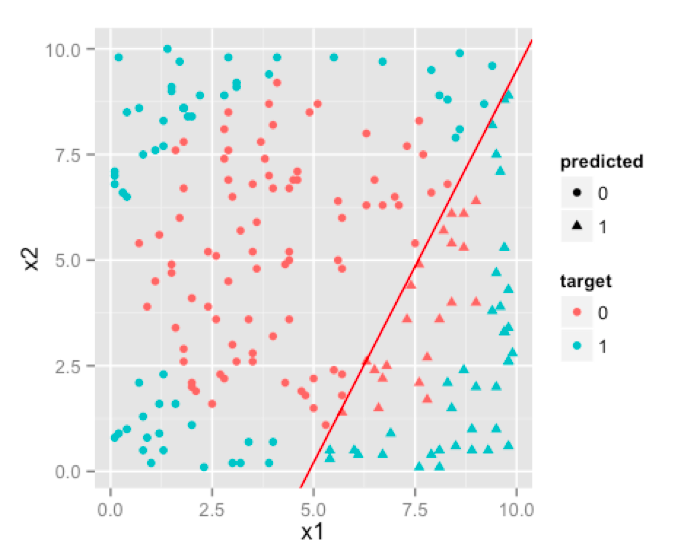
You can see that, it doesn’t do a very good job. Because whatever you do, decision boundary produced by logistic regression will always be linear , which can not emulate a circular decision boundary which is required. So, logistic regression will work for classification problems where classes are approximately linearly separable. [Although you can make classes linear separable in some cases through variable transformation, but we’ll leave that discussion for some other day].
能看出来,这并不能得到一个很好地结果。因为不论我们做什么,逻辑回归得到的决策曲线都回事线性的。而线性曲线并不能拟合出我们需要的圆形曲线。所以逻辑回归能够很好地胜任分布近似于线性的分类问题。
Now lets see how decision trees handle these problems. We know that decision trees are made of hierarchical one variable rules . Such an example for our data is given below.
现在来看看决策树怎么处理这些问题。我们知道决策树是构建一个多层次的变量规则。对于我们的数据,有如下一个例子。
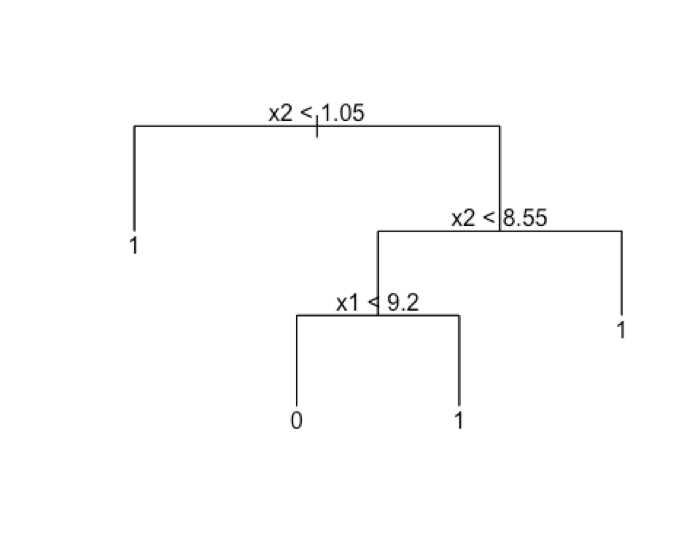
If you think carefully, these decision rules x2 |</>| const OR x1 |</>| const do nothing but partition the feature space with lines parallel to each feature axis like the diagram given below.
如果你仔细思考下,这些决策规则x2和一个常数的关系或者x1和一个常数的大小关系,仅仅是用平行线将特征空间分区。就像下图:
We can make our tree more complex by increasing its size , which will result in more and more partitions trying to emulate the circular boundary.
我们可以通过构建更加复杂的决策树,而结果是我们得到了众多的分区来拟合那个圆形的边界。
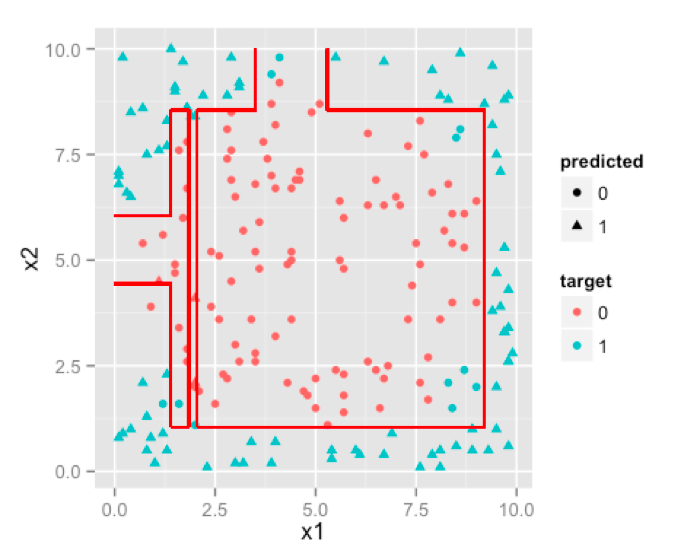
Ha! not a circle but it tried, that much credit is due. If you keep on increasing size of the tree , you’d notice that decision boundary will try to emulate circle as much as it can with parallel lines.So, if boundary is non-linear and can be approximated by cutting feature space into rectangles [ or cuboids or hyper-cuboid for higher dimensions ] then D-Trees are a better choice than logistic regression.
虽然不是一个圆,不过它在尽可能的接近它。如果继续扩大树的规模,我们会发现决策边界就是尽平行线最大的可能去拟合圆。所以,如果边界不是现行的,但特征空间可以近似的被切割成矩形,那么相对于逻辑回归,决策树将会是一个比较好的选择。
Next we’ll look at result of SVM. SVM works by projecting your feature space into kernel space and making the classes linearly separable. An easier explanation to that process would be that SVM adds an extra dimension to your feature space in a way that makes classes linearly separable. This planar decision boundary when projected back to original feature space emulates non linear decision boundary . Here this picture might explain better than me.
接下来看看SVM的结果。SVM通过将你的特征空间映射到内核空间,而使得数据线性可分。一个最简单的解释就是SVM通过某种方法为特征空间增加额外的维度,将数据映射到高维空间进而线性可分。得到一个决策平面,随后再映射回原始空间,进而拟合非线性的边界。
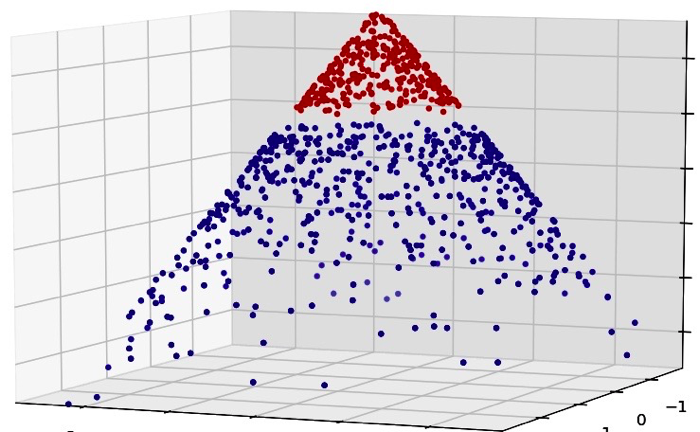
You can see that , once a third dimension in a special manner added to data , we can separate two classes with a plane [ a linear separator ], which once projected back onto the original 2-D feature space; becomes a circular boundary.
可以看出,一旦将数据以特定的手段三维化后,就可以通过一个平面或者一个线性分界来区分两种类别。而将其映射回原始二维特种空间后,我们得到了一个圆形边界。
see how well SVM performs on our sample data:
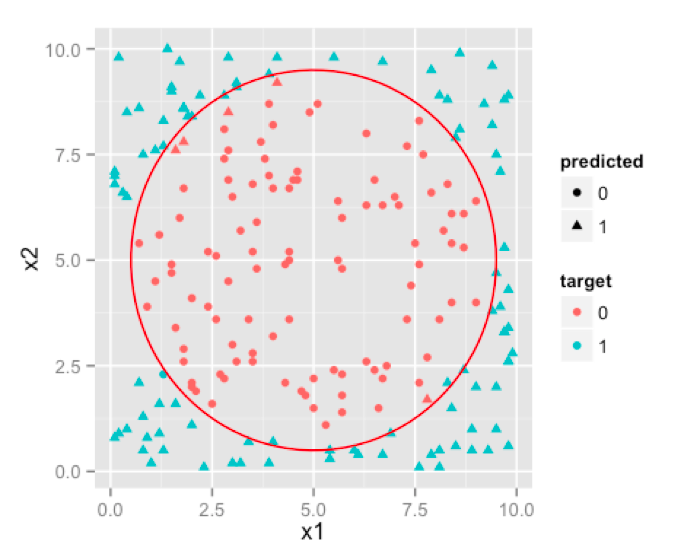
Note: The decision boundary will not be such a well rounded circle , but rather a very good approximation [a polygon] to it. We have used simple circle to avoid getting into hassle of drawing a tedious polygon in our software.
当然决策边界可能不是这么完美的圆形,但为了更好地估计它,我们简单的用圆形表示它,从而避免了我们的软件纠结于绘制复杂的多边形。
OK, so now the difference makes sense , but one question still remains. That is , when to choose which algorithm when dealing with multi dimensional data? This is a very important question because , you’ll not have such a convenient method of visualizing data when there are more than 3 predictors to be considered. We’ll discuss that in 2nd part of this post, stay tuned!
现在很多情况了解了,但还是有好多问题遗留。在处理高维数据时,什么时候选择什么样的算法?这是个非常重要的问题,因为当数据超过3维,我们很难方便的可视化数据进而做出决定。静候第二部分吧~