引入——标题、色条、坐标轴、图例等
例一:
set(groot,'defaultAxesLineStyleOrder','remove','defaultAxesColorOrder','remove');
%每次使用记得清除上次设置的参数,否则设置的参数会被保留下来
X = linspace(0,2*pi,30);
Y = [cos(X); exp(0.05*X)]';
m = stem(X,Y); %m是图像的句柄
title('这里是标题'); %标题
xlabel('x的坐标/m'); %坐标轴
ylabel('y的坐标/t','fontsize',14);
legend('图一','图二','Location','southeast','FontSize',19); %方法一
legend({'图一','图二'},'Position',[0.65,0.2,0.2,0.1],'FontWeight','bold'); %方法二
legend('boxoff'); %Remove the legend border.
%鼠标可以直接移动legend,双击文字还可更改文字内容
text(0.2,-0.7,'这里可以填文字','fontsize',10,'FontWeight','bold');
axis(gca,[0 6 -1 1.5]); %%设置只显示X=-3:3,Y=-2:4,Z=-10:10范围的图像
axis tight %以最大范围(定义域的范围)显示此图像
%axis auto %将坐标轴设为自动返回缺省值
grid on; %显示网格
set(gca,'xtick',0:0.75:7); %设置x轴的刻度区间为0.75,既每隔0.75标注一个点
grid off; %消除网格
m(1).Color = 'k';
m(1).LineStyle='--';
m(2).Marker = 's'; %square
hbase=m.BaseLine;
hbase.BaseValue=0.7;
hbase.LineStyle='-.';
set(gca,'color','y'); %设置图像的背景颜色为黄色
axis off;
hbase.Visible = 'off';
axis on;
例二:
peaks; m=gca;
axis(m,[-3 3 -4 4,-10,10]); %%设置只显示X=-3:3,Y=-2:4,Z=-10:10范围的图像
% 只有上式可以更改了取值范围,下式只能更改区间间隔
set(m,'xtick',-3:0.75:2); %设置x轴的左边范围及间隔
set(gca, 'XTick', []); % 隐藏x轴的标记
set(gca, 'YTick', []); % 隐藏y轴的标记
box on %把三维图形封闭的箱体里,箱子大小用axis定义
hcb = colorbar('southoutside'); %横向放置的colorbar
%%colorbar; %显示横放的色条(默认)
set(get(hcb,'Xlabel'),'String','这是横向放置的colorbar','FontSize',12);
%设置的是colorbar的Xlabel,然后加上文字 文字大小为12
%在显示的图像中,用鼠标点击Edit->Colormap选项可以手动更改颜色区间
set(hcb,'Ticks',[-5,-2,1,4,7],'TickLabels',{'Cold','Cool','Neutral','Warm','Hot'})
%Specify Colorbar Ticks(标记) and Tick Labels
set(hcb,'Direction','reverse'); %反转colorbar的方向,连同文字一起反向
colormap autumn %颜色映射表colormap,如果没有定义C,则按Z(高度)进行颜色的映射
%还有多种选项,具体参考matlab帮助——colormap
shading interp %%shading使图像的网格曲面美观
%进行插值,可平滑小面描影并删除网格线
%还有其他参数shading flat;shading faceted;效果可以参考帮助
2、视点处理
%MATLAB提供了设置视点的函数view,其调用格式为:
view(-34,50); %设置观测者的位置,方位角za=34,仰角el=30
%方位角从负y轴逆时针起算(向左为负,向右为正),
%仰角从xoy面向上起算(向上为正);
view(3);%以默认视角查看该图。(默认az=-37.5,el=30,单位:°)
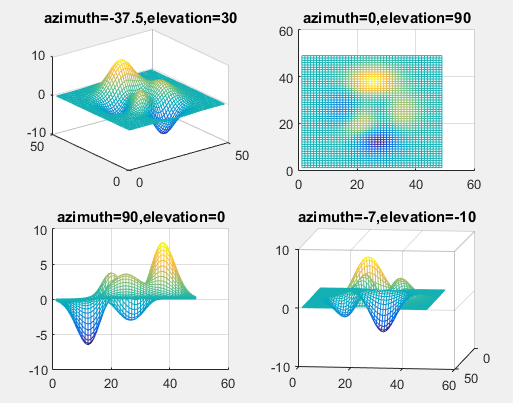
应用举例:从不同的角度查看多峰函数(peaks)
subplot(2,2,1);mesh(peaks);
view(-37.5,30); %指定子图1的视点
title('azimuth=-37.5,elevation=30')
subplot(2,2,2);mesh(peaks);
view(0,90); %指定子图2的视点
title('azimuth=0,elevation=90')
subplot(2,2,3);mesh(peaks);
view(90,0); %指定子图3的视点
title('azimuth=90,elevation=0')
subplot(2,2,4);mesh(peaks);
view(-7,-10); %指定子图4的视点
title('azimuth=-7,elevation=-10')
3、色彩处理
1.色图
色图(Color map)是MATLAB系统引入的概念。在MATLAB中,每个图形窗口只能有一个色图。色图是m×3 的数值矩阵,它的每一行是RGB三元组。色图矩阵可以人为地生成,也可以调用MATLAB提供的函数来定义色图矩阵。
我的解释:colormap代表就是一个映射,它不是函数类型的映射,而是用一个三列向量来代表,三个分量分别代表R、G、B。
在数字图像中,它可以将灰度图映射为伪彩色图像,如下图:
A = imread('pout.tif') ;
imshow(A);colorbar
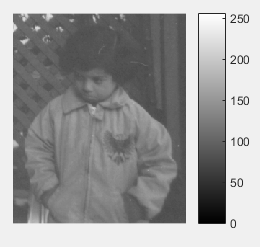
colormap jet
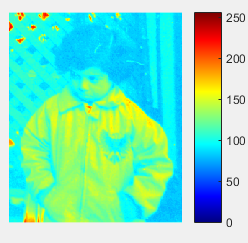
colormap gray %返回到原图
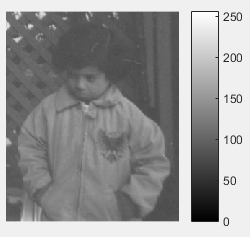
所以可以把数字图像的每个点的灰度看做普通三维图像的Z轴,将Z轴高度映射为colormap中的颜色;
详细可以参考:__传送门__
《数字图像处理Matlab》—— 冈萨雷斯P147 的解释:
索引图像(伪彩色图像)有两个分量,即整数矩阵X和彩色映射矩阵map.矩阵map是一个大小为m*3且范围在[0,1]之间的浮点值构成的double类数组。map的长度m同它所定义的颜色数目相等。map的每一行都定义单身的红、绿、蓝三个分量。索引图像将像素值“直接映射”到彩色值。每个像素的颜色有对应的整数矩阵X的值作为指向map的一个指针决定。

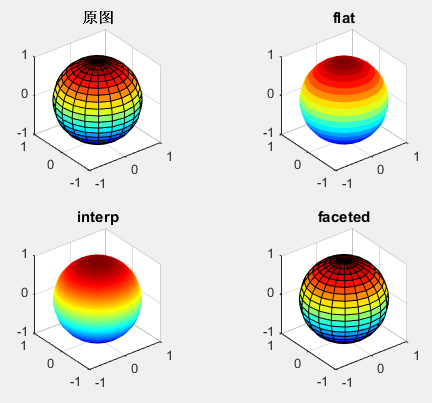
%surf函数用默认/缺省的着色方式对网格片着色。
%除此之外,还可以用shading命令来改变着色方式。
%%3种图形着色方式的效果展示。
[x,y,z]=sphere(20);
subplot(2,2,1);surf(x,y,z);
axis equal;title('原图')
subplot(2,2,2);surf(x,y,z);
shading flat;%each mesh line segment and face has a constant color determined by the color value
%at the endpoint of the segment or the corner of the face that___has the smallest index or indices(索引)___.
axis equal;title('flat')
subplot(2,2,3);surf(x,y,z);
shading interp; %命令在网格片内采用颜色插值处理,得出的表面图显得最光滑
% varies the color in each line segment and face by interpolating the colormap index or true color value across the line or face.
axis equal;title('interp')
subplot(2,2,4);surf(x,y,z);
shading faceted %命令将每个网格片用其高度对应的颜色进行着色,但网格线仍保留着
% flat shading with superimposed(叠加) black mesh lines. This is the default shading mode.
axis equal;title('faceted')
colormap jet;
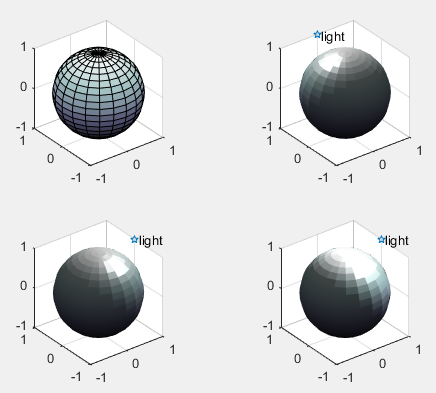
5、光照处理
%MATLAB提供了灯光设置的函数,其调用格式为:
%light('Color',选项1,'Style',选项2,'Position',选项3)
[x,y,z]=sphere(20);
subplot(2,2,1);
surf(x,y,z);axis equal;%原图
subplot(2,2,2);
surf(x,y,z);axis equal;
light('Posi',[0,1,1]);
shading interp;hold on;
plot3(0,1,1,'p');text(0,1,1,' light');
hold off;
subplot(2,2,3);
surf(x,y,z);axis equal;
light('Posi',[1,0,1]);
shading interp;
hold on;
plot3(1,0,1,'p');text(1,0,1,' light');
hold off
subplot(2,2,4);
surf(x,y,z);axis equal;
light('Posi',[1,0,1]);
light('Posi',[1,0,1]); %重复两次光照
shading interp;hold on;
plot3(1,0,1,'p');text(1,0,1,' light');
colormap bone
6、图形的裁剪处理
%绘制三维曲面图,并进行插值着色处理,裁掉图中x^2+y^2<=1部分
[x,y]=meshgrid(-5:0.1:5);
z=cos(x).*cos(y).*exp(-sqrt(x.^2+y.^2)/4);
surf(x,y,z);shading interp;
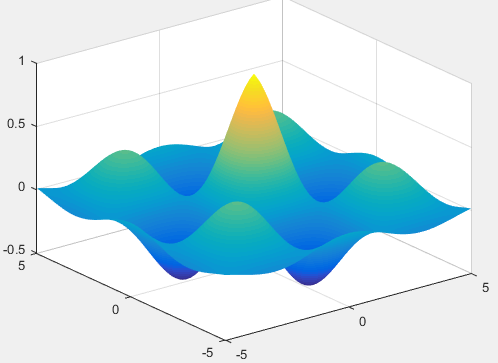
pause %程序暂停
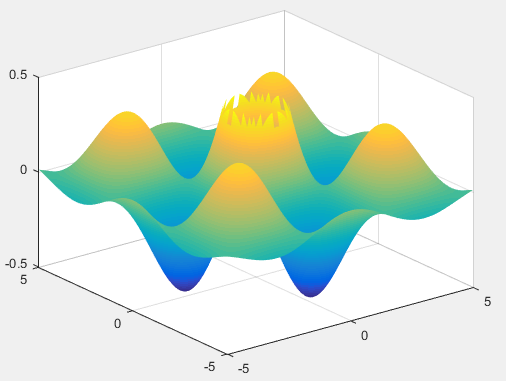
%为了展示裁剪效果,第一个曲面绘制完成后暂停,然后显示裁剪后的曲面。
i=find(x.^2+y.^2<=1);
z1=z;z1(i)=NaN;
surf(x,y,z1);shading interp;
<wiz_tmp_tag id="wiz-table-range-border" contenteditable="false" style="display: none;">