SSRS创建复合型图表
1.添加报表数据对应代码:
if object_id('tb') is not null
 drop table tb;
go
CREATE TABLE tb(yearid int,[population] int,income int)

go
insert into tb(yearid,[population],income)
select 2010 as id,100000 as population,123456 as income
union all select 2011,110000,1346000
union all select 2012,115000,1200000
union all select 2013,120000,1500000
2.先制作直方图如下所示
效果图

设计图

3.添加一个新的value


4.改变income的图表类型
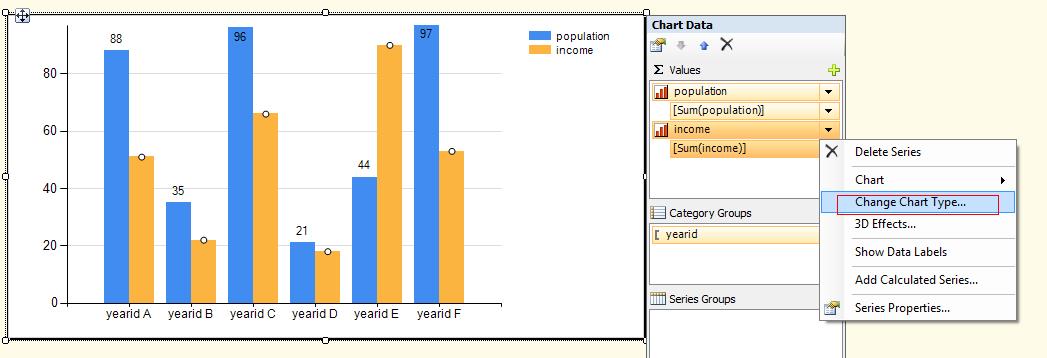
5.选择line chart

6.结果如下:

