echart 参数 vue配置 图文展示

https://blog.csdn.net/she_lover/article/details/51448967

https://blog.csdn.net/n_meng/article/details/78593743

以上博客写的很清楚,但是对应找属性和方法不是很好找,最近写项目用到echart正好记录以下。

一.npm安装echarts

npm install echarts --save

二.在mian.js里面导入echarts

import echart from 'echarts'
  //挂载echart
  Vue.prototype.$echarts = echart

三.使用echart(目前是父组件引用子组件,具体的参数配置和使用都在子组件里面编写)

1.自定义的子组件1html代码(barechart.vue)

1 <template>
2     <div id="main1" style="height:300px;"></div>
3 </template>

2.自定义的子组件1内容(直接代码了,该加注释的都加了)

1 mounted () {
2       this.$nextTick(function(){
3           this.drawbarechart();
4       })
5 },
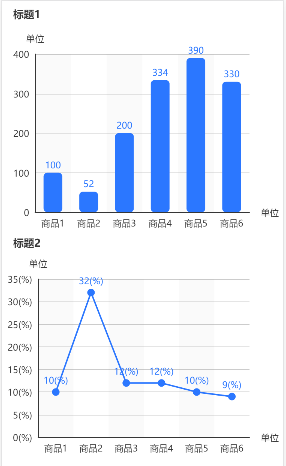
 1 methods: {
 2         drawbarechart() {
 3             let _this = this;
 4             this.charts = this.$echarts.init(document.getElementById('main1'))
 5             this.charts.setOption({
 6                 title:{     //设置标题的样式
 7                     padding:[0,15],
 8                     text:_this.titletext,
 9                     // text:'标题1',
10                     // x:'center',
11                     textStyle:{
12                         fontSize:14,
13                         color:'#333',
14                     }
15                 },
16                 tooltip:{   //设置悬浮框的样式
17                     trigger:'axis',
18                     confine:true,
19                     axisPointer:{
20                         type:'shadow'
21                     }
22                 },
23                 grid:{  //设置canvas构造内容的边距
24                     left:'4%',
25                     right:'12%',
26                     bottom:'3%',
27                     containLabel:true
28                 },
29                 xAxis:{ //X轴参数配置
30                     type:'category',
31                     name:_this.xAxisname,
32                     data:_this.xAxisdata,
33                     // axisLine:{       // 坐标轴线
34                     //     show:true,   // 默认显示,属性show控制显示与否
35                     //     lineStyle:{  // 属性lineStyle控制线条样式
36                     //         color:'#ddd'
37                     //     }
38                     // },
39                     // axisLabel:{
40                     //     show:true,
41                     //     textStyle:{
42                     //         color:'#333'
43                     //     }
44                     // },
45                     splitLine:{show:false},    // 分隔线
46                     splitArea:{         // 分隔区域
47                         show:true,      // 默认不显示,属性show控制显示与否
48                         areaStyle:{     // 属性areaStyle(详见areaStyle)控制区域样式
49                             color:[
50                                 'rgba(100,100,100,0.03)',
51                                 'rgba(100,100,100,0)'
52                             ]
53                         }
54                     },
55                     axisTick:{  //轴上的齿度是否显示
56                         alignWithLabel:true,
57                         show:false
58                     }
59                 },
60                 yAxis:{     //X轴参数配置
61                     type:'value',
62                     name:_this.yAxisname,
63 
64                     // splitLine:{show: false},//去除网格线
65 
66                     axisTick:{  //轴上的齿度是否显示
67                         show:false
68                     }
69                 },
70                 series:[    //柱形的参数配置
71                     {
72                         name:_this.seriesname,
73                         type:'bar',
74                         barWidth: '25',
75                         data:_this.seriesdata,
76 
77                         itemStyle:{
78                             normal:{
79                                 barBorderRadius:[5, 5, 5, 5],
80                                 color:'rgb(72,118,254)',
81                                 label:{
82                                     show:true,
83                                     position:'top',
84                                     textStyle:{
85                                         color:'rgb(72,118,254)'
86                                     }
87                                 }
88                             }
89                         }
90                     }
91                 ]
92             })
93         }
94     },

3.以下是自定义子组件2,折线图(lineechart.vue)

1 <template>
2     <div id="main2" style="height:300px;background:#ffffff"></div>
3 </template>

4.自定义的子组件2内容(直接代码了,该加注释的都加了)

  1 mounted () {  3         this.$nextTick(function(){
  4             this.drawlineechart();
  5         })
  6         
  7     },
  8     methods: {
  9         drawlineechart() {
 10             let _this = this;
 11             this.charts = this.$echarts.init(document.getElementById('main2'))
 12             this.charts.setOption({
 13                 title:{
 14                     text:_this.titletext,
 15                     // text:'标题2',
 16                     padding:[5,15],
 17                     // x:'center',
 18                     textStyle:{
 19                         fontSize:14,
 20                         color:'#333'
 21                     }
 22                 },
 23                 tooltip:{
 24                     trigger:'axis',
 25                 },
 26                 grid:{
 27                     left:'2%',
 28                     right:'12%',
 29                     bottom:'3%',
 30                     containLabel:true
 31                 },
 32                 xAxis:{
 33                     type:'category',
 34                     name:_this.xAxisname,
 35                     splitLine:{show:false},
 36                     // boundaryGap:false,
 37                     data:_this.xAxisdata,
 38                     splitArea:{
 39                         show:true,
 40                         areaStyle:{
 41                             color:[
 42                                 'rgba(100,100,100,0.03)',
 43                                 'rgba(100,100,100,0)'
 44                             ]
 45                         }
 46                     },
 47 
 48                     // axisLine:{       // 坐标轴线
 49                     //     show:true,   // 默认显示,属性show控制显示与否
 50                     //     lineStyle:{  // 属性lineStyle控制线条样式
 51                     //         color:'#111'
 52                     //     }
 53                     // },
 54                     // axisLabel:{
 55                     //     show:true,
 56                     //     interval:0,     //X轴字段全部显示出来,默认不显示完可以把该项去掉
 57                     //     textStyle:{
 58                     //         color:'#111'
 59                     //     }
 60                     // },
 61                     splitLine:{show:false},    // 分隔线
 62                     // splitArea:{         // 分隔区域
 63                     //     show:true,      // 默认不显示,属性show控制显示与否
 64                     //     areaStyle:{     // 属性areaStyle(详见areaStyle)控制区域样式
 65                     //         color:[
 66                     //             'rgba(100,100,100,0.03)',
 67                     //             'rgba(100,100,100,0)'
 68                     //         ]
 69                     //     }
 70                     // },
 71                     axisTick:{
 72                         show:false
 73                     }
 74                 },
 75                 yAxis:{
 76                     type:'value',
 77                     name:_this.yAxisname,
 78 
 79                     // axisLine:{       // 坐标轴线
 80                     //     show:true,   // 默认显示,属性show控制显示与否
 81                     //     lineStyle:{  // 属性lineStyle控制线条样式
 82                     //         color:'#666'
 83                     //     }
 84                     // },
 85 
 86                     // splitLine:{show: false},//去除网格线
 87 
 88                     axisLabel:{
 89                         formatter:'{value}(%)'
 90                     },
 91                     axisTick:{
 92                         show:false
 93                     }
 94                 },
 95                 series:[
 96                     {
 97                         name:_this.seriesname,
 98                         type:'line',
 99 
100                         symbol:'circle',    //折线图拐点
101 
102                         symbolSize:10,
103                         showAllSymbol:true,
104                         data:_this.seriesdata,
105 
106                         itemStyle:{
107                             normal:{
108                                 color:'rgb(72,118,254)',
109                                 label:{
110                                     show:true,
111                                     position:'top',
112                                     formatter:'{c}(%)',     //在series加上单位
113                                     textStyle:{
114                                         color:'rgb(72,118,254)'
115                                     }
116                                 }
117                             }
118                         }
119                     },
120                     
121                 ]
122             })
123         }
124     },

 以上,关于echart各种常用的参数,就是这次的主要内容。

 稍微更新一下:目前需求有跟着屏幕大小自动去刷新echart宽高,试了多种方式,最终解决了单个页面多个echart图自适应宽高问题:

1 window.addEventListener('resize', ()=> {
2                 this.charts.resize();
3             })

加在setOption后面即可。

window.addEventListener('resize', ()=> {
this.charts.resize();
})
原文地址:https://www.cnblogs.com/start-ming/p/10974179.html