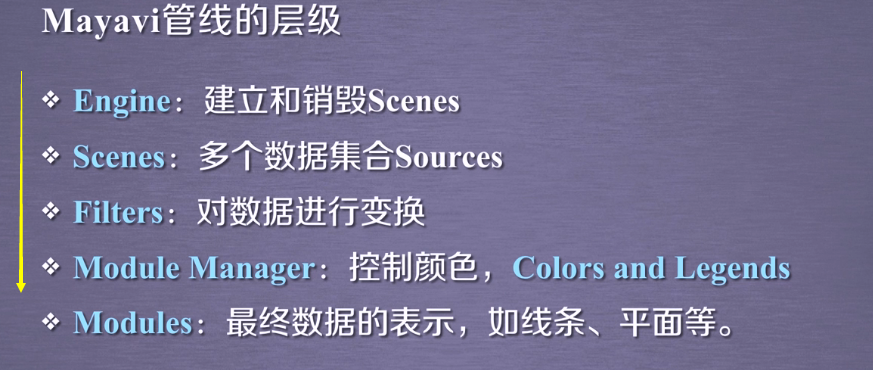
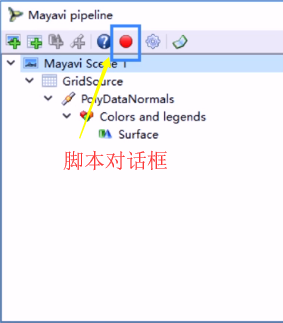
一:Mayavi管线
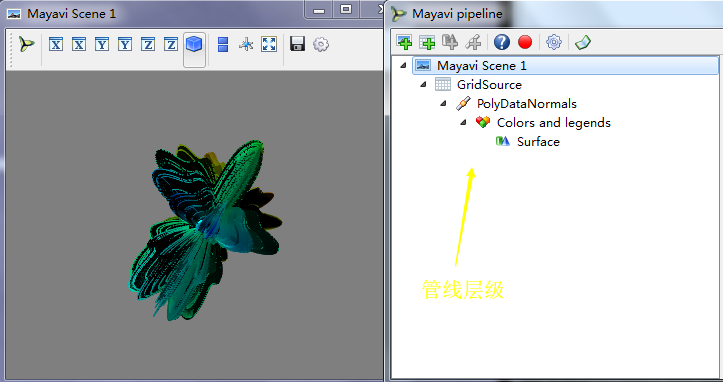
mlab.show_pipeline() #显示管线层级,来打开管线对话框
(一)管线中的对象scene
Mayavi Scene:处于树的最顶层的对象,他表示场景,配置界面中可以设置场景的背景,前景色,场景中的灯光,以及其他一些选项
>>> s = mlab.gcf()  #获取当前场景
>>> print(s)  #获取当前场景状态
<mayavi.core.scene.Scene object at 0x00000000014E66D0>
>>> print(s.scene.background)  #输出管线中的背景色
(0.5, 0.5, 0.5)
(二)GridSource网格数据源
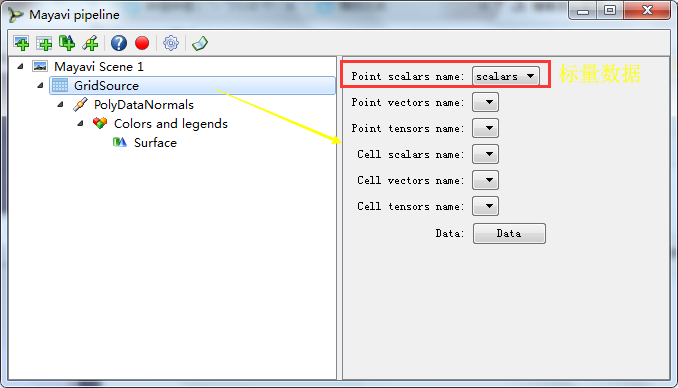
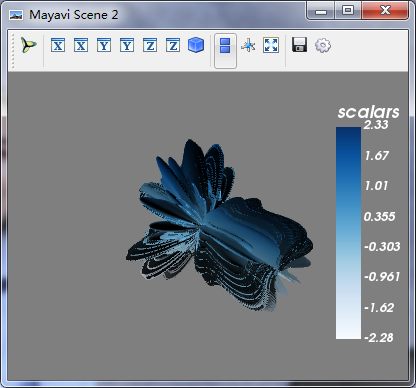
scalars标量数据,他就是传递给mesh的标量数组,他表示mesh表面的每个点的数组
>>> source = s.children[0]  #获取GridSource对象,因为scene场景中有多个数据集合sources,我们获取当前唯一的这一个
>>> print(repr(source))  #打印返回的字符串
<mayavi.sources.vtk_data_source.VTKDataSource object at 0x0000000014117570>
>>> print(source.name)  #返回该节点的名称
GridSource

>>> print(repr(source.data.points))  #打印GridSource的坐标(空间坐标,三维)
[(0.0, 1.0852211291184772, 0.0), ..., (-0.01969313518771439, -1.5671711510166164
, -0.00024748426251406075)], length = 126504  #length说明坐标数组大小是126504

>>> print(repr(source.data.point_data.scalars))  #打印出每个点对应的标量数组
[0.0, ..., -0.00024748426251406075], length = 126504
(三)PolyDataNormals是数据源的法向量
>>> manager = source.children[0]
>>> print(manager)
<mayavi.filters.poly_data_normals.PolyDataNormals object at 0x00000000163D1308>
(四)Colors and legends
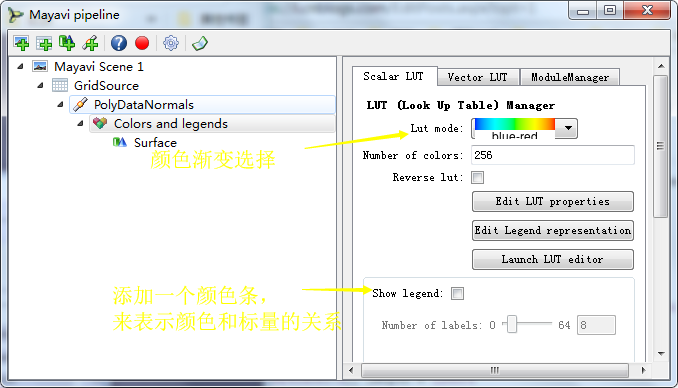
>>> colors = manager.children[0]
>>> colors.scalar_lut_manager.lut_mode = "Blues"
>>> colors.scalar_lut_manager.show_legend = True
(五)Surface对象:将GridSource输出的PolyData数据转换为最终的在场景中显示的三维实体
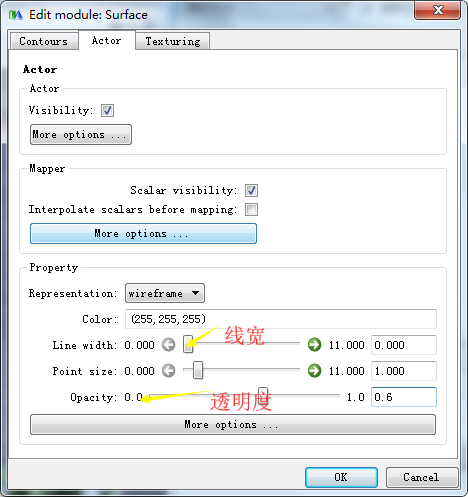
>>> surface = colors.children[0]    #获得颜色的第一个子节点
>>> surface.actor.property.representation = "wireframe"
>>> surface.actor.property.opacity = 0.6
总结:程序配置属性的步骤
1.获取场景对象,mlab.gcf()
2.通过children属性,在管线中找到需要修改的对象
3.当其配置窗口由多个选项卡,属性需要一级一级获得
Mayavi管线:是层级管线,相互嵌套,需要使用children获取下一级
TVTK管线:分为可视化管线和图形管线两部分,用于将TVTK中各个对象穿连起来