一. 四种监控方式
1) Logging:应用程序,开发中间件,web系统等所输出的一些结构化/非结构化的日志,例如应用程序通过一个滚动的文件输出debug或error信息,并通过日志收集系统存储到Elasticsearch中。这是一种最常见的一种监控方式。
2)Tracing:比如分布式调用链CAT(Central Application Tracking),就是Tracing。Tracing有开始和结束。
3)Metrics:Metrics和Logging有点类似,Logging属于离散(不连续的)事件,Logging一半记录的是文本信息。而Metrics记录的是数值,可以聚合,是一段时间内某个度量(计数器或者直方图)的原子或者是元数据,可用于查看某段时间某个参数的指标及其趋势。例如接收的HTTP数量可以被建模为计数器,每次的HTTP请求即是我们的度量元数据,可以进行简单的加法聚合,当持续了一段时间我们又可以建模为直方图。
4)HelathCheck:用于系统健康检查,用于定期检查某个站点服务器是否存活。这种监控方式也是非常重要,常用于集群中。

Prometheus监控则覆盖HelathCheck和Metrics这两种方式。Prometheus专注于衡量系统,随着时间的推移可能会越来越多地追踪,从而成为Tracing的指标。
这四种监控方式比较如下图:
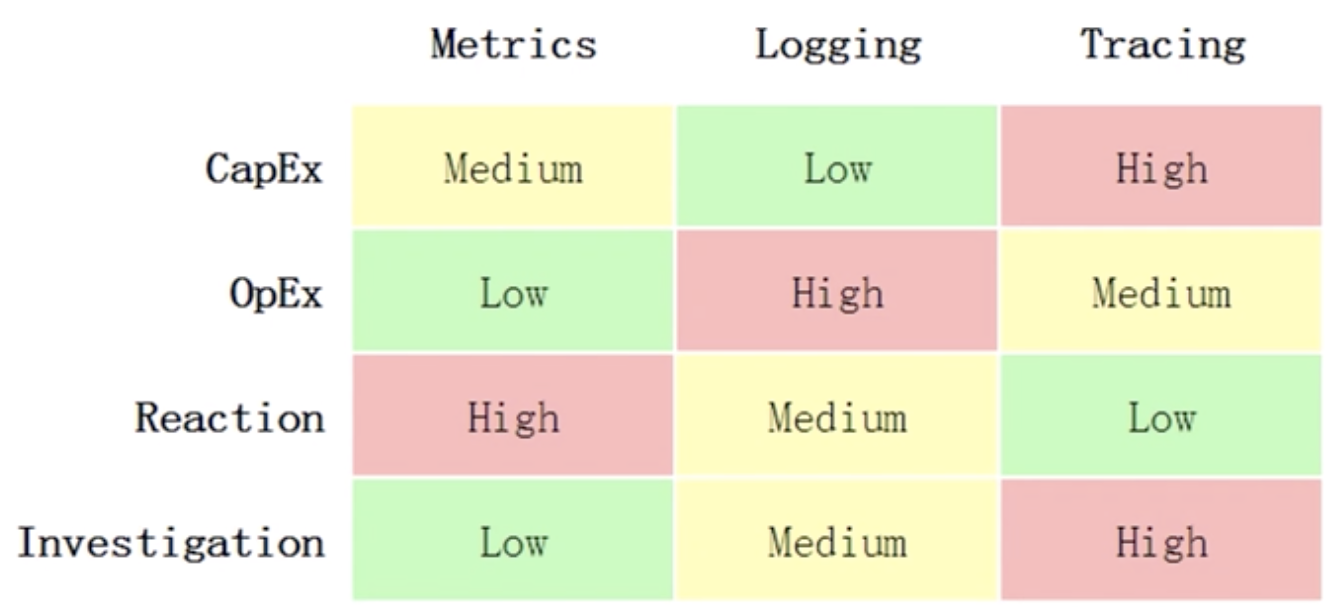
图片来源:https://peter.bourgon.org/go-for-industrial-programming/
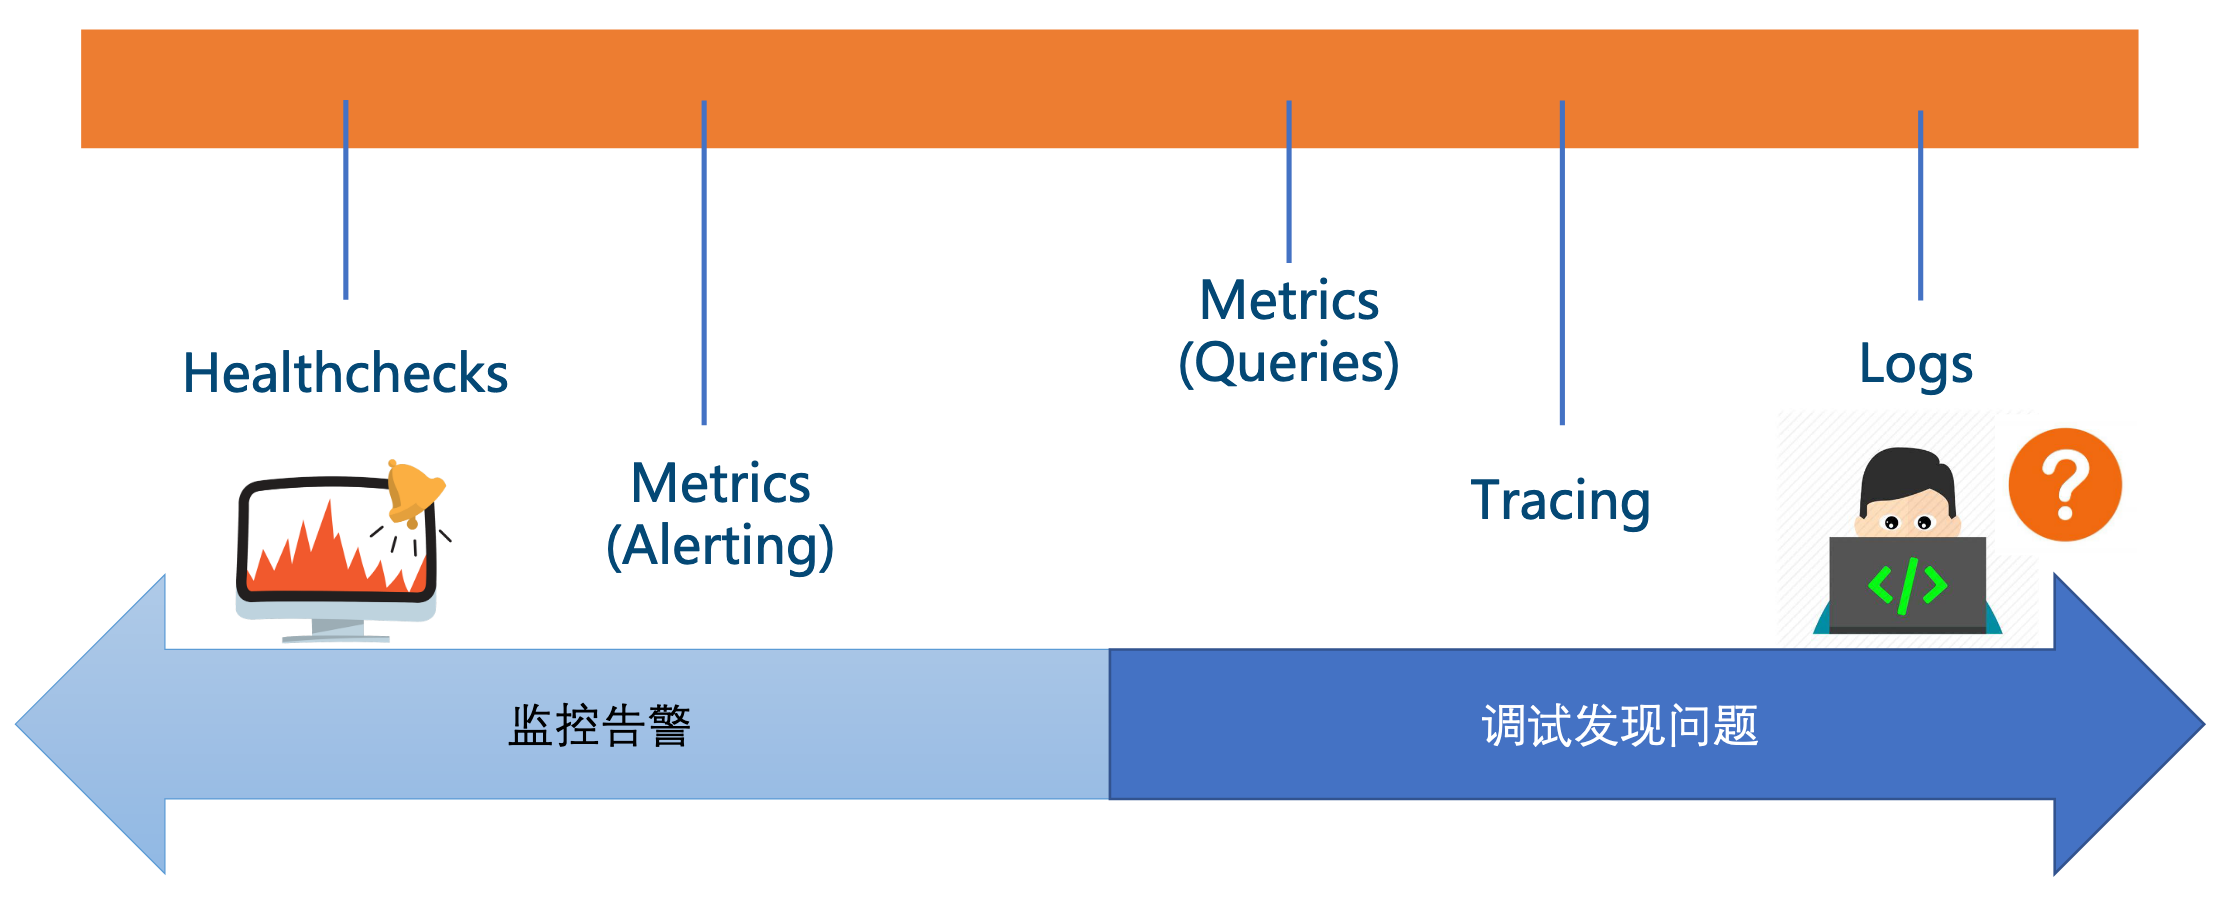
几种监控方式适用场景
Metrics监控分层

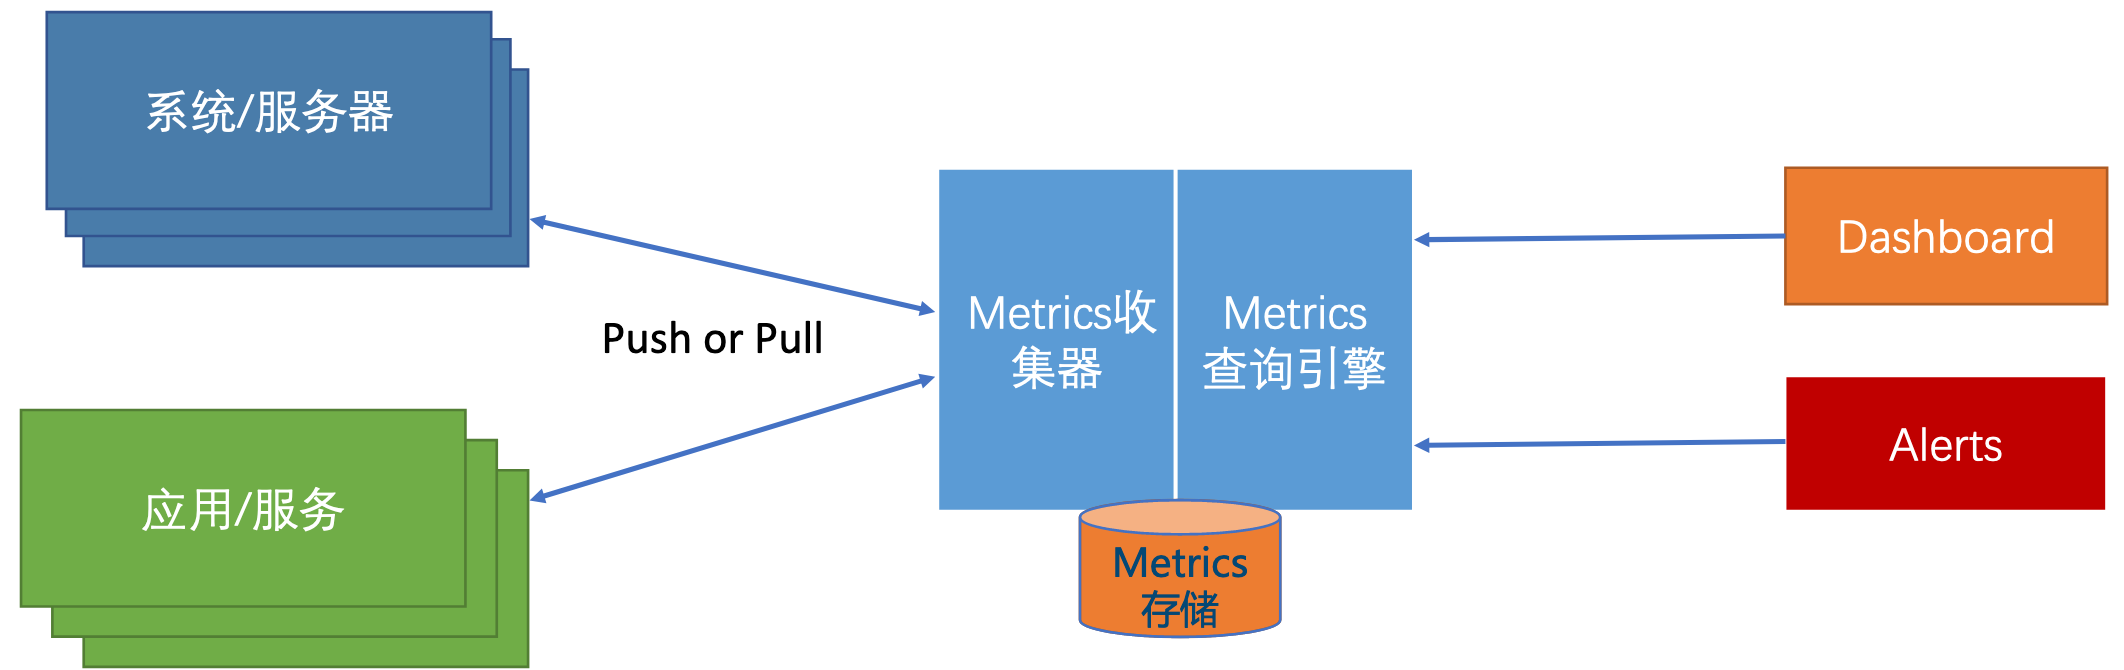
Metrics通用监控架构模式
二. MDD理念
MDD(Metrics Driven Development)度量驱动开发。
二. 什么是Prometheus?
Prometheus(普罗米修斯)是由德国SoundCloud公司开发的开源监控报警系统和时序列数据库(TSDB)。Prometheus使用Go语言开发,是Google BorgMon监控系统的开源版本。2016年由Google发起Linux基金会旗下的原生云基金会(Cloud Native Computing Foundation), 将Prometheus纳入其下第二大开源项目。
Prometheus目前在开源社区相当活跃。Prometheus和Heapster(Heapster是K8S的一个子项目,用于获取集群的性能数据。)相比功能更完善、更全面。Prometheus性能也足够支撑上万台规模的集群。
Prometheus官网地址:https://prometheus.io/
Prometheus官网文档地址:https://prometheus.io/docs/introduction/overview/
Prometheus github地址:https://github.com/prometheus/prometheus
Prometheus特点:
1)多维度(标签),拉模式(Pull-based)。
2)白盒(可以深入应用内部来抓取指标数据),黑盒(把应用当成黑盒来监控)监控都支持,。DevOps友好。
三. Prometheus架构
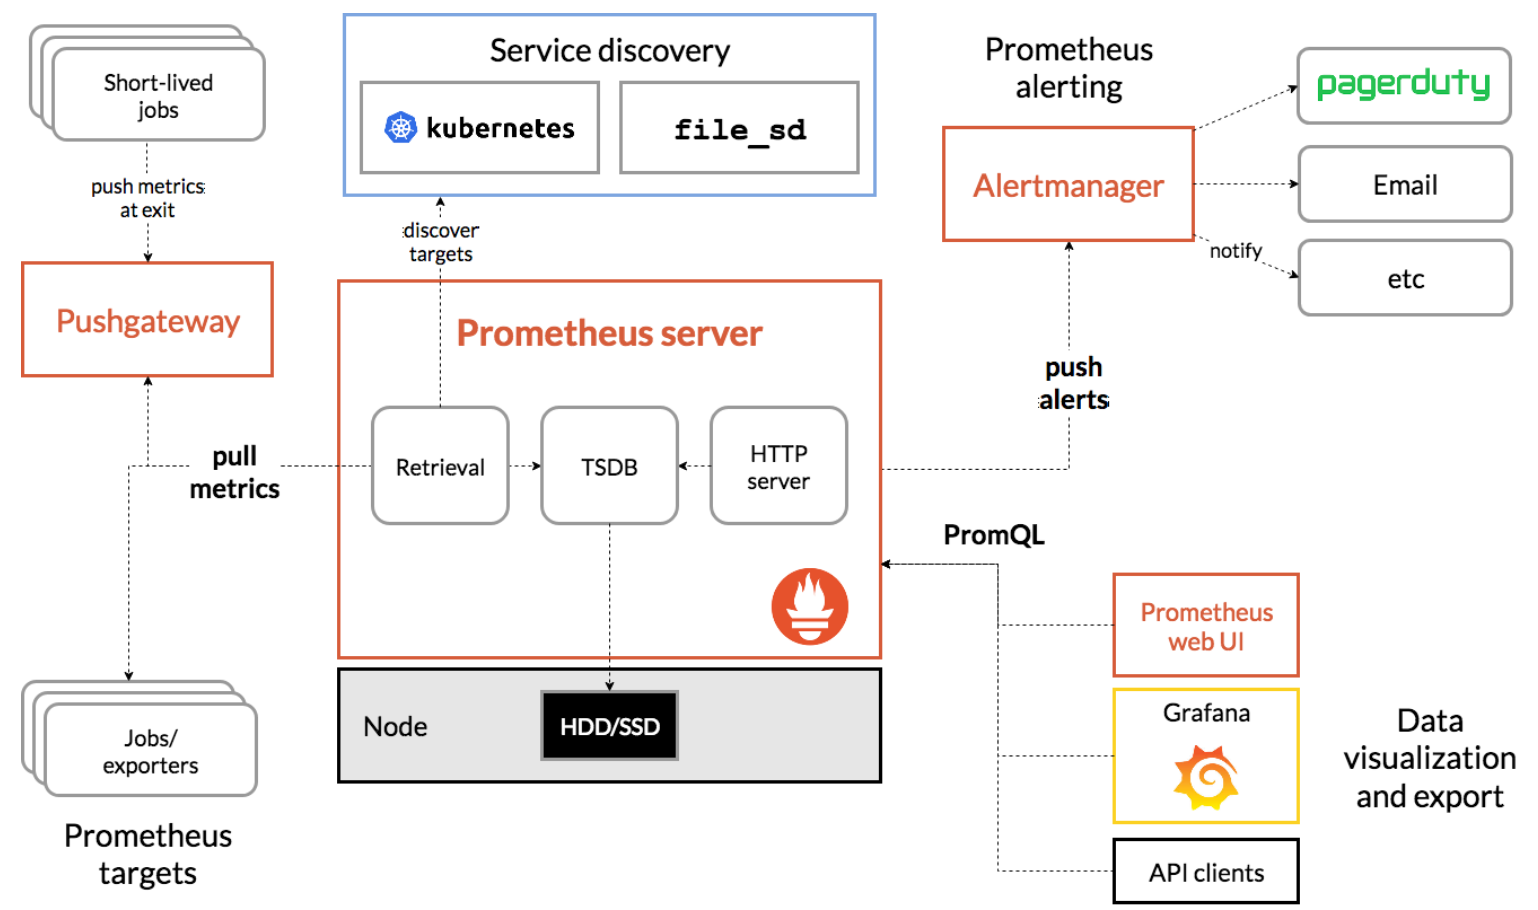
Prometheus基本工作原理
Prometheus的基本原理是通过HTTP协议周期性抓取被监控组件的状态,任意组件只要提供对应的HTTP接口就可以接入监控。不需要任何SDK或者其他的集成过程。这样做非常适合做虚拟化环境监控系统,比如VM、Docker、Kubernetes等。输出被监控组件信息的HTTP接口被叫做exporter 。目前互联网公司常用的组件大部分都有exporter可以直接使用,比如Varnish、Haproxy、Nginx、MySQL、Linux系统信息(包括磁盘、内存、CPU、网络等等)。
Prometheus与其他监控系统对比
Prometheus对比Zabbix
1. Zabbix使用的是 C 和 PHP, Prometheus 使用 Golang, 整体而言 Prometheus 运行速度更快一点。
2. Zabbix 属于传统主机监控主要用于物理主机、交换机、网络等监控Prometheus 不仅适用主机监控还适用于 Cloud、SaaS、Openstack、Container 监控。
3. Zabbix 在传统主机监控方面有更丰富的插件。
Prometheus vs. Zabbix
作者:KaliArch
链接:https://www.imooc.com/article/details/id/292361
来源:慕课网
本文首次发布于慕课网 ,转载请注明出处,谢谢合作
Prometheus环境搭建
Prometheus下载官网地址:https://prometheus.io/download/
windows版:https://download.csdn.net/download/qq_38688267/12683264
Linux版: https://download.csdn.net/download/qq_38688267/12728855
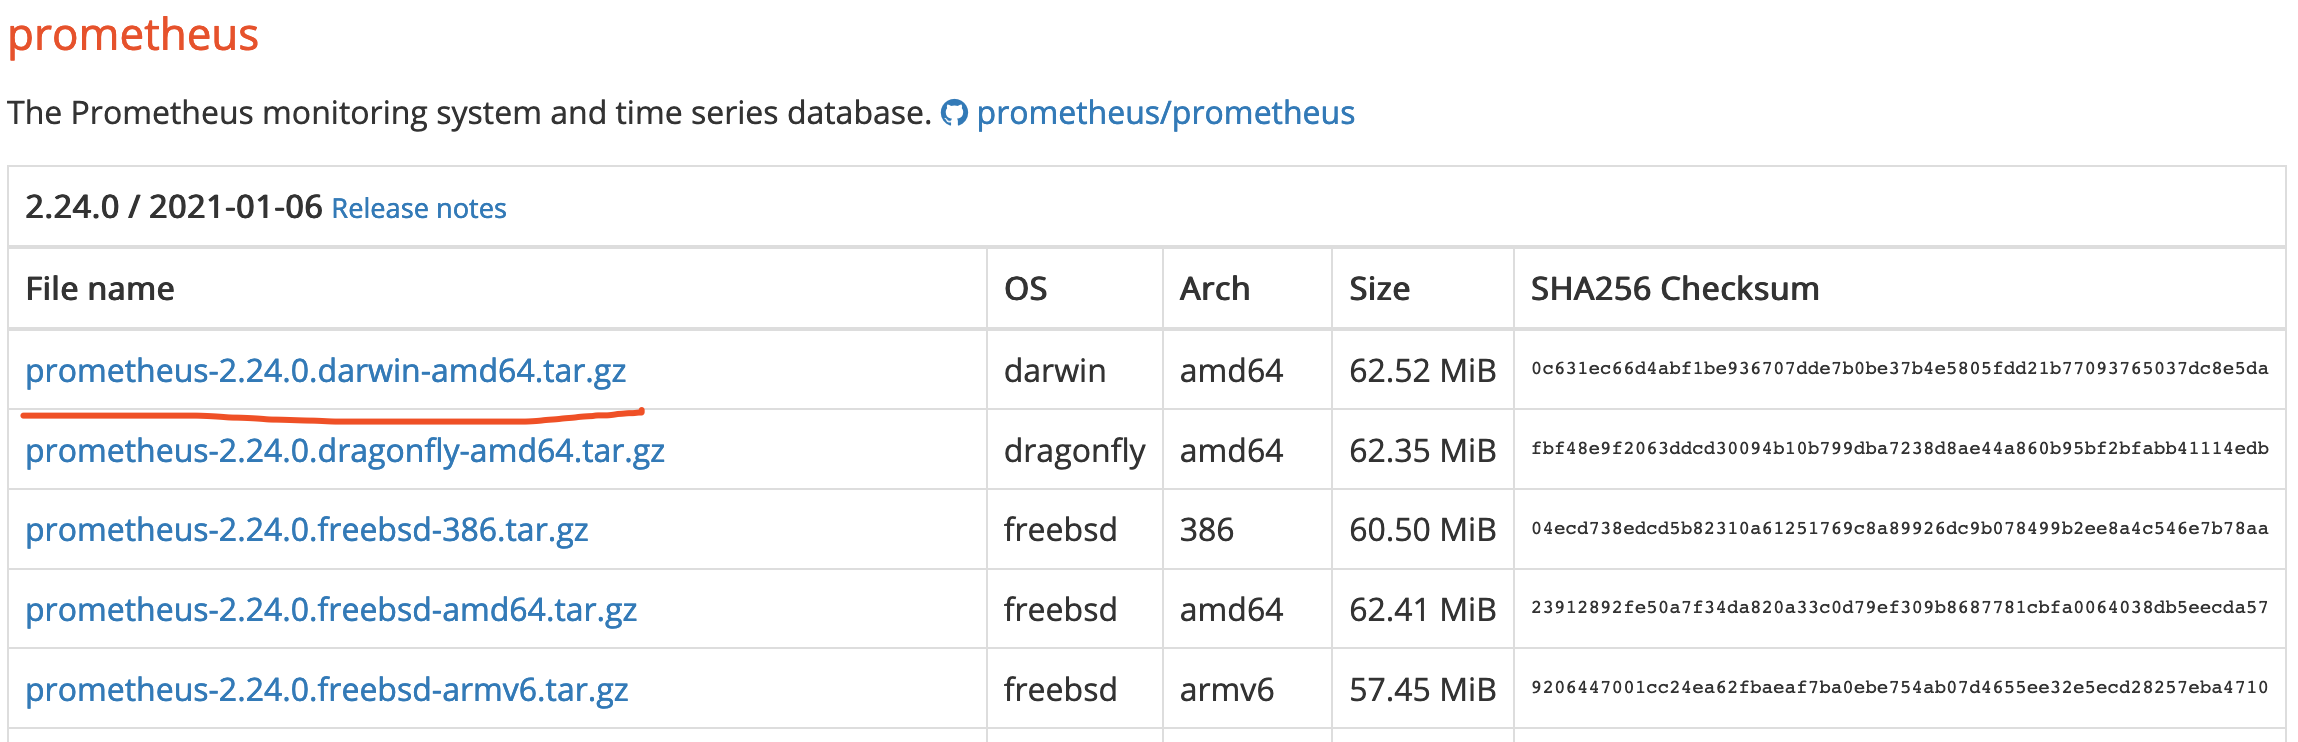
我是mac系统,下载的是这个版本。不过mac下用brew安装更为方便。
1. brew安装prometheus
brew install prometheus
安装完后安装路径为:/usr/local/Cellar/prometheus/2.22.0/
2. 默认配置文件在/usr/local/etc/prometheus.yml,内容如下,可以看见prometheus访问为localhost:9090
global:
  scrape_interval: 15s

scrape_configs:
  - job_name: "prometheus"
    static_configs:
    - targets: ["localhost:9090"]
3. 启动prometheus命令
prometheus --config.file=/usr/local/etc/prometheus.yml
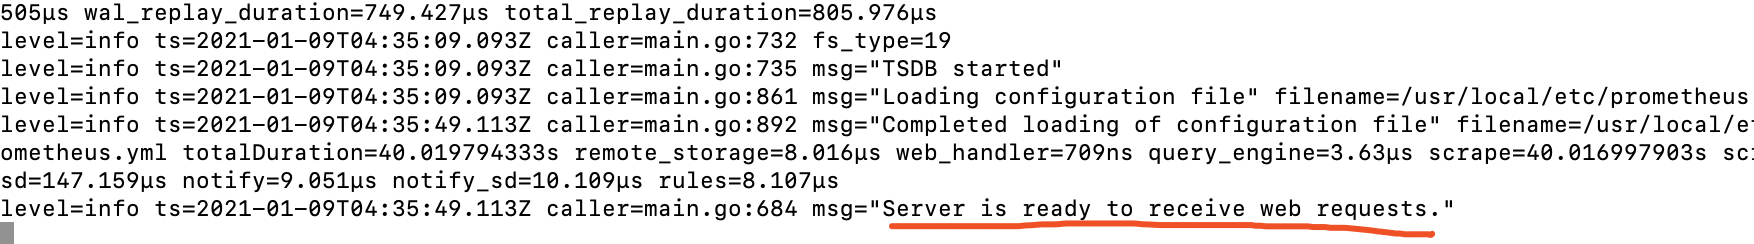
当提示如下说明启动成功就可以在浏览器上访问localhost:9090
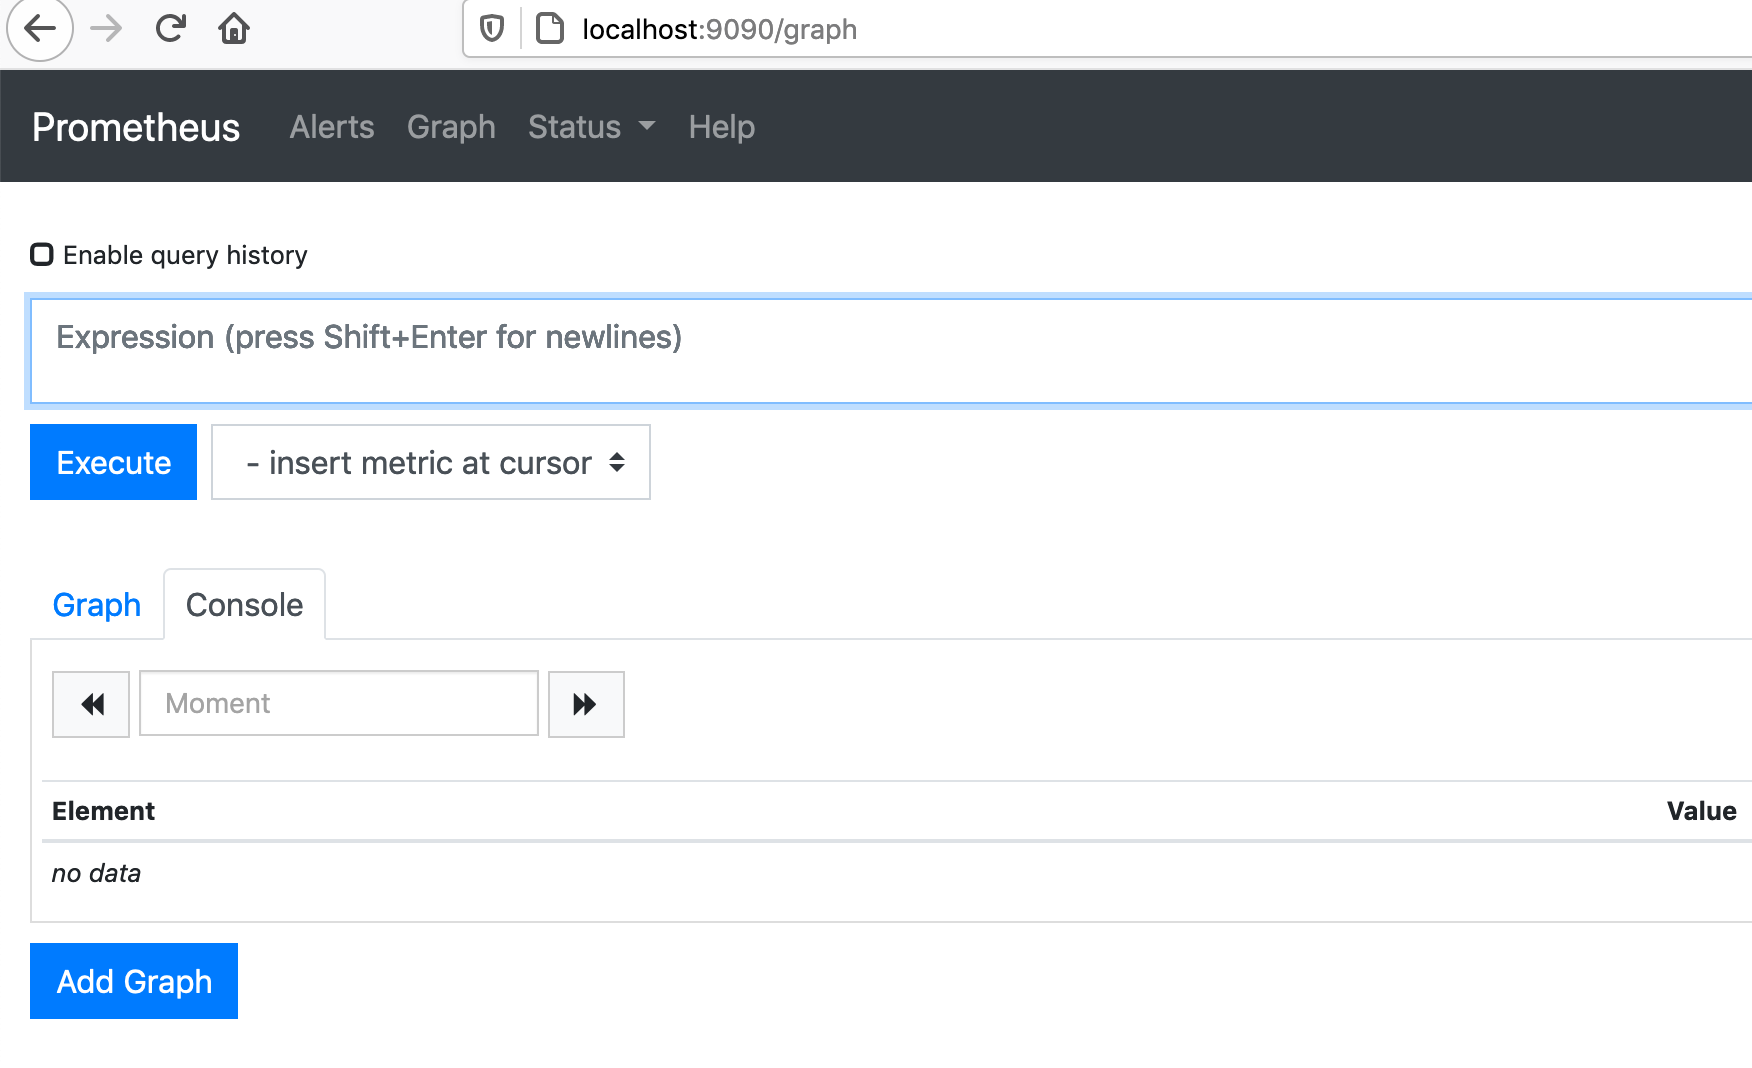
访问后展示如下dashboard界面
prometheus还有metrics页面,输入http://localhost:9090/metrics地址,这个页面展示了相关metrics指标,如下图,这些指标大多是prometheus自己提供,也是说prometheus自己可以监控自己。

在metrice中出现的指标,在dashboard中是可以搜索的,如我要搜索prometheus_engine相关的指标。

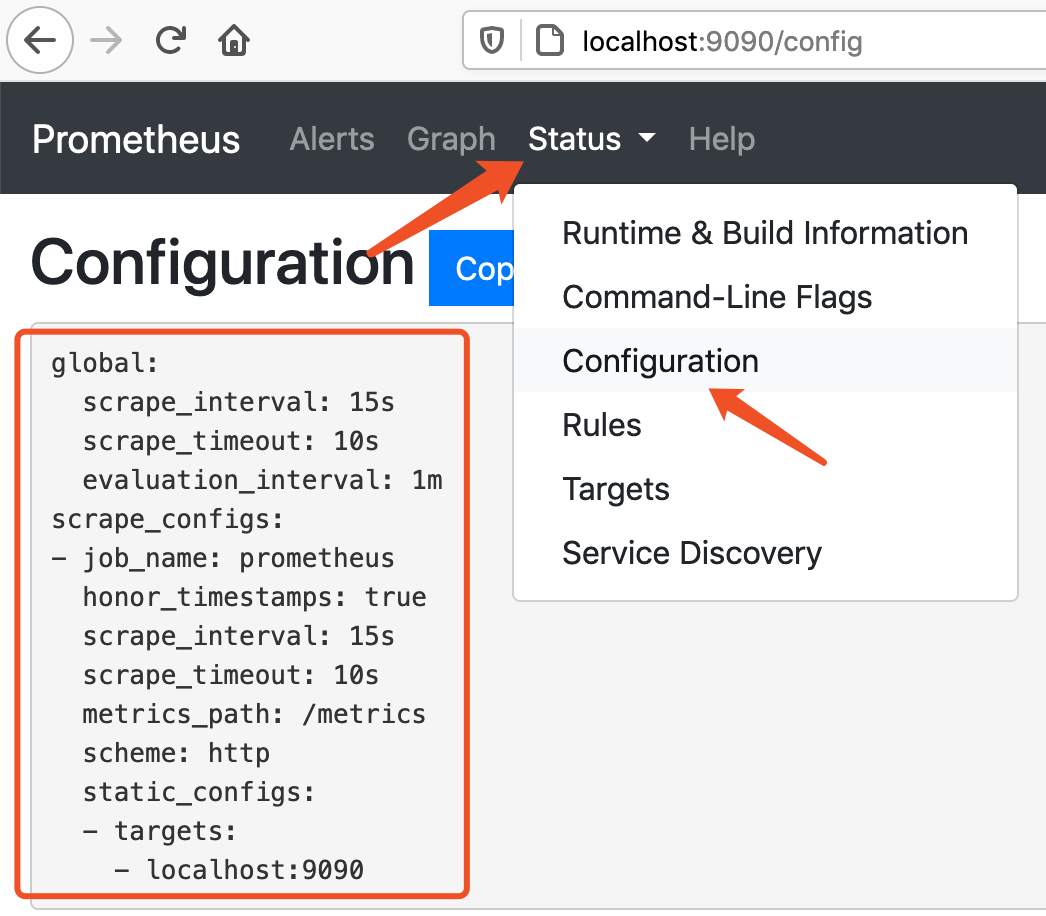
在status菜单可以看到配置信息
4. prometheus启动和关闭说明
如果发现启动时候端口被占用,使用命令查看
lsof -i tcp:9090
然后在根据PID在使用kill -9来终止掉。
Prometheus 提供了 HTTP 关闭接口,但在使用之前,需要通过 --web.enable-lifecycle 参数开启 lifecycle 功能,然后你就可以使用 HTTP 请求来关闭程序了,例如:
curl -X POST http://localhost:9090/-/quit
此时 HTTP 接口会返回:
Requesting termination... Goodbye!
prometheus配置说明
官网配置文档说明:https://prometheus.io/docs/prometheus/latest/configuration/configuration/
Prometheus可以在运行时重新加载其配置。如果想要重载Prometheus配置,可以给Prometheus的主进程发送SIGHUP信号或者发送post请求给指定端点 /-/reload(前提条件是在启动时加上--web.enable-lifecycle启动参数)
Prometheus的配置文件是YAML格式,当我们运行prometheus二进制文件时,我们通过参数可指定一个配置文件。
prometheus --config.file=prometheus.yml
Prometheus的配置文件主要分四块:
1) global:配置文件的全局信息配置。比如配置两次信息抓取间隔,配置抓取超时时间等。
2)alerting:告警配置。
3)rule_files:告警规则。
4)scrape_configs:配置数据源,称为target,每个target用job_name命名。又分为静态配置和服务发现。
下面是配置文件说明
global:   # 全局配置
  scrape_interval:     15s # 默认抓取周期,可用单位ms、smhdwy #设置每15s采集数据一次,默认1分钟
  evaluation_interval: 15s # 估算规则的默认周期 # 每15秒计算一次规则。默认1分钟
  # scrape_timeout is set to the global default (10s).

# Alertmanager configuration
alerting:
  alertmanagers:
  - static_configs:
    - targets:
      # - alertmanager:9093

# 规则文件列表
rule_files:
  # - "first_rules.yml"
  # - "second_rules.yml"

# A scrape configuration containing exactly one endpoint to scrape:
# 抓取配置列表 下面static_configs设置要抓取信息等地址,比如这里抓取就是Prometheus自己
scrape_configs:
  # The job name is added as a label `job=<job_name>` to any timeseries scraped from this config.
  - job_name: 'prometheus'

    # metrics_path defaults to '/metrics'
    # scheme defaults to 'http'.  #这里表示所使用的网络协议比如http

    static_configs:
    - targets: ['localhost:9090']
Prometheus环境文件及存储
Prometheus包括一个本地磁盘时间序列数据库,但也可选择与远程存储系统集成。
Grafana使用
Grafana 是一套开源的分析监视平台,支持 Graphite, InfluxDB, OpenTSDB, Prometheus, Elasticsearch, CloudWatch 等数据源,其 UI 非常漂亮且高度定制化。
Grafana-7.1下载
windows版:https://download.csdn.net/download/qq_38688267/12683258
Linux版:https://download.csdn.net/download/qq_38688267/12728849
Mac安装
brew install grafana
安装好后路径是
/usr/local/Cellar/grafana/7.2.2
启动命令
grafana-server --config=/usr/local/etc/grafana/grafana.ini --homepath /usr/local/share/grafana --packaging=brew cfg:default.paths.logs=/usr/local/var/log/grafana cfg:default.paths.data=/usr/local/var/lib/grafana cfg:default.paths.plugins=/usr/local/var/lib/grafana/plugins
命令输入后会看到下面日志信息
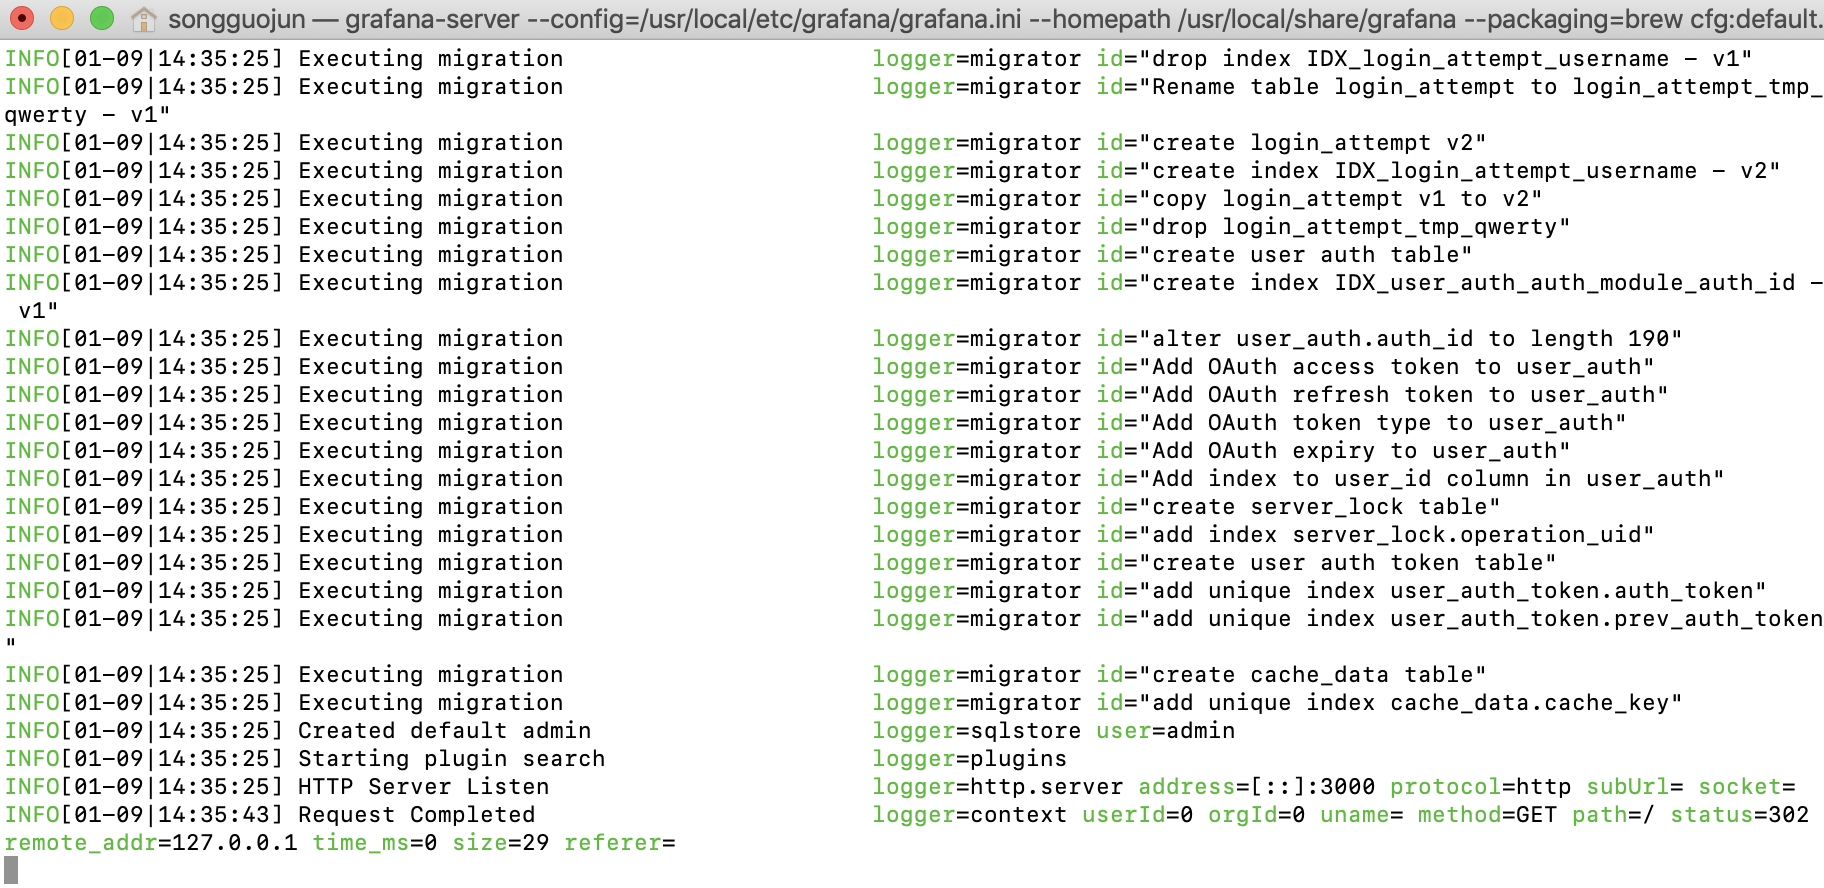
启动完成后,浏览http://localhost:3000/进入首页(注:如需修改默认端口,可修改/usr/local/etc/grafana/grafana.ini 这个文件),默认用户名和密码都是admin,使用前必须更改密码。
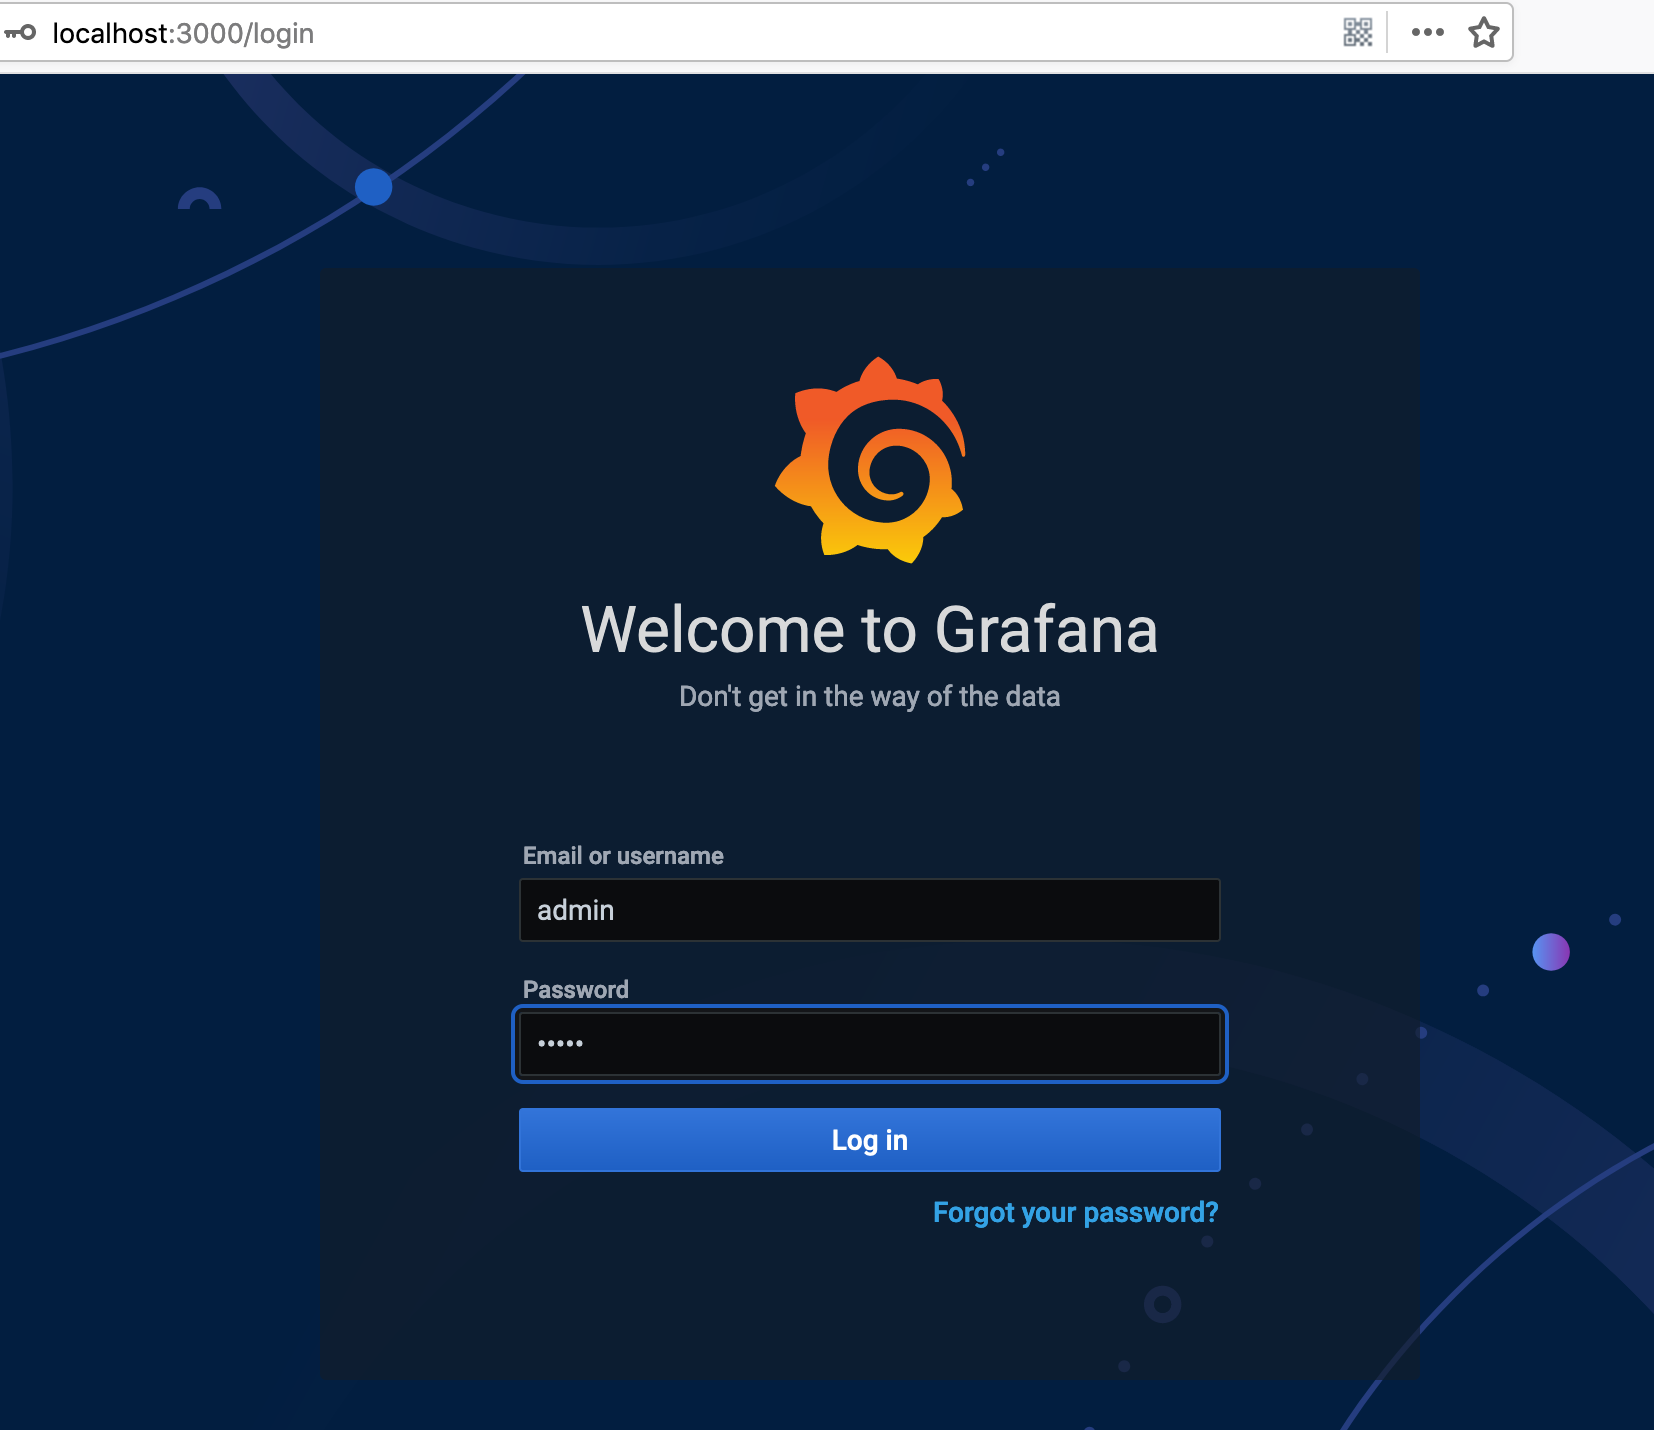
登陆成功后就是下面这样