Java 系统性能分析 命令
1. cpu分析
top , pidstat(sysstat)
pid -p PID -t 1 10
vmstat 1 CPU上下文切换、运行队列、利用率
ps Hh -eo tid
pcpu 查看具体线程的CPU消耗
sar 来查看一定世界范围内以及历史的cpu消耗情况信息
查看java线程信息
jstack pid | grep 'nid=0x9999'
2. cs sy消耗比较高
上下文切换性能偏高, jstack -l pid, 查看on object monitor
3. io消耗
pidstat -d -t -p pid 1 100
iostat
4. 网络io消耗
cat /proc/interruptes
sar -n FULL 1 2
tcpdump
http://www.cnblogs.com/lidabo/p/4738113.html
近期java应用,CPU使用率一直很高,经常达到100%,通过以下步骤完美解决,分享一下。
方法一:
转载:http://www.linuxhot.com/java-cpu-used-high.html
1.jps 获取Java进程的PID。
2.jstack pid >> java.txt 导出CPU占用高进程的线程栈。
3.top -H -p PID 查看对应进程的哪个线程占用CPU过高。
4.echo “obase=16; PID” | bc 将线程的PID转换为16进制,大写转换为小写。
5.在第二步导出的Java.txt中查找转换成为16进制的线程PID。找到对应的线程栈。
6.分析负载高的线程栈都是什么业务操作。优化程序并处理问题。
方法二:
1.使用top 定位到占用CPU高的进程PID
top
通过ps aux | grep PID命令
2.获取线程信息,并找到占用CPU高的线程
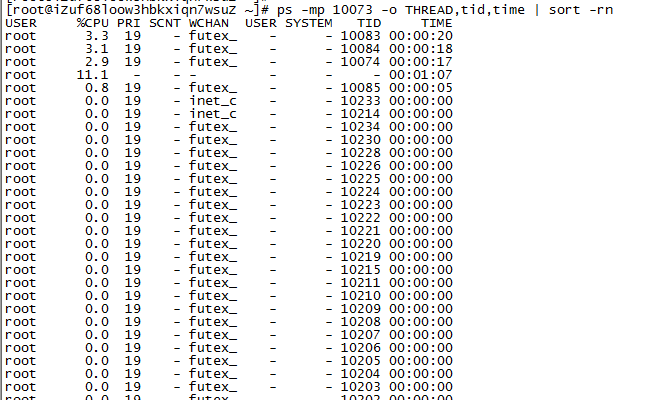
ps -mp pid -o THREAD,tid,time | sort -rn
譬如:
ps -mp 10073 -o THREAD,tid,time | sort -rn
3.将需要的线程ID转换为16进制格式
printf "%x
" tid
4.打印线程的堆栈信息
jstack pid |grep tid -A 30
http://www.cnblogs.com/pangguoping/p/5715848.html
c233 plugins # ps -elf|head -1
F S UID PID PPID C PRI NI ADDR SZ WCHAN STIME TTY TIME CMD
4 S root 28149 4204 0 80 0 - 16283 poll_s Jul05 ? 00:00:00 sshd: root
73
PROCESS FLAGS
The sum of these values is displayed in the "F" column, which is provided by the flags output specifier.
1 forked but didn't exec
4 used super-user privileges
(1)S列.
D Uninterruptible sleep (usually IO)
R Running or runnable (on run queue)
S Interruptible sleep (waiting for an event to complete)
T Stopped, either by a job control signal or because it is being traced.
W paging (not valid since the 2.6.xx kernel)
X dead (should never be seen)
Z Defunct ("zombie") process, terminated but not reaped by its parent.
(3)C列.C pcpu cpu utilization
(4)
command COMMAND see args. (alias args, cmd).
sz SZ size in physical pages of the core image of the process. This
includes text, data, and stack space. Device mappings are currently
excluded; this is subject to change. See vsz and rss.
(5)WCHAN列.
wchan WCHAN name of the kernel function in which the process is sleeping,
a "-" if the process is running, or a "*" if the process is
multi-threaded and ps is not displaying threads.
二、统计当前运行的线程总数."-L"
c233 plugins # ps -eLf|grep -v $$|wc -l //-L Show threads, possibly with LWP and NLWP columns
646
c233 plugins # ps -eLf|grep -v $$|tail
UID PID PPID LWP C NLWP STIME TTY TIME CMD
root 23678 1 688 0 36 Jul01 ? 00:00:06 /usr/sbin/nscd
root 23678 1 689 0 36 Jul01 ? 00:00:06 /usr/sbin/nscd
root 23678 1 690 0 36 Jul01 ? 00:00:06 /usr/sbin/nscd
root 23678 1 691 0 36 Jul01 ? 00:00:06 /usr/sbin/nscd
root 23678 1 692 0 36 Jul01 ? 00:00:06 /usr/sbin/nscd
root 23678 1 693 0 36 Jul01 ? 00:00:06 /usr/sbin/nscd
root 23678 1 694 0 36 Jul01 ? 00:00:06 /usr/sbin/nscd
root 23678 1 695 0 36 Jul01 ? 00:00:06 /usr/sbin/nscd
root 23678 1 696 0 36 Jul01 ? 00:00:06 /usr/sbin/nscd
root 28149 4204 28149 0 1 Jul05 ? 00:00:00 sshd: root
NLWP (number of threads)
LWP (thread ID)
c233 plugins # ps -ef|grep nscd
root 23678 1 0 Jun30 ? 00:15:32 /usr/sbin/nscd
三、Linux下查看某个进程的线程数量.
1.根据进程号进行查询:
# pstree -p 进程号 //-p pid
# top -Hp 进程号 //-H : Threads toggle
2.根据进程名字进行查询:
# pstree -p `ps -e | grep sshd | awk '{print $1}'`
# pstree -p `ps -e | grep sshd | awk '{print $1}'` | wc -l
http://www.cnblogs.com/itcomputer/p/4652140.html
003_监测域名证书过期时间
由于因为线上证书过期,出过比较大的事故,所以就有了如下的监测证书过期的脚本
#!/bin/sh
### SSL Certificate Expire Day Check Script ###
if [ "$1" = '' ];then
    echo "Need URL."
    exit
1;fi
TARGET_URL=$1
EXP_DAY=`openssl s_client -connect ${TARGET_URL}:443 < /dev/null 2> /dev/null | openssl x509 -text 2> /dev/null | grep "Not After" | sed -e 's/^ *//g' | cut -d " " -f 4,5,6,7,8`
NOW_TIME=`date +%s`
EXP_TIME=`date +%s -d "${EXP_DAY}"`
if [ "${EXP_DAY}" != '' -a ${NOW_TIME} -lt ${EXP_TIME} ]; then
    echo $(((EXP_TIME-NOW_TIME)/(60*60*24)))
else
    echo "ERROR"
    exit 1;
fi
http://www.cnblogs.com/itcomputer/p/7192734.html
Linux通过PID查看进程完整信息
说明
通过ps及top命令查看进程信息时,只能查到相对路径,查不到的进程的详细信息,如绝对路径等。
先通过top查看进程PID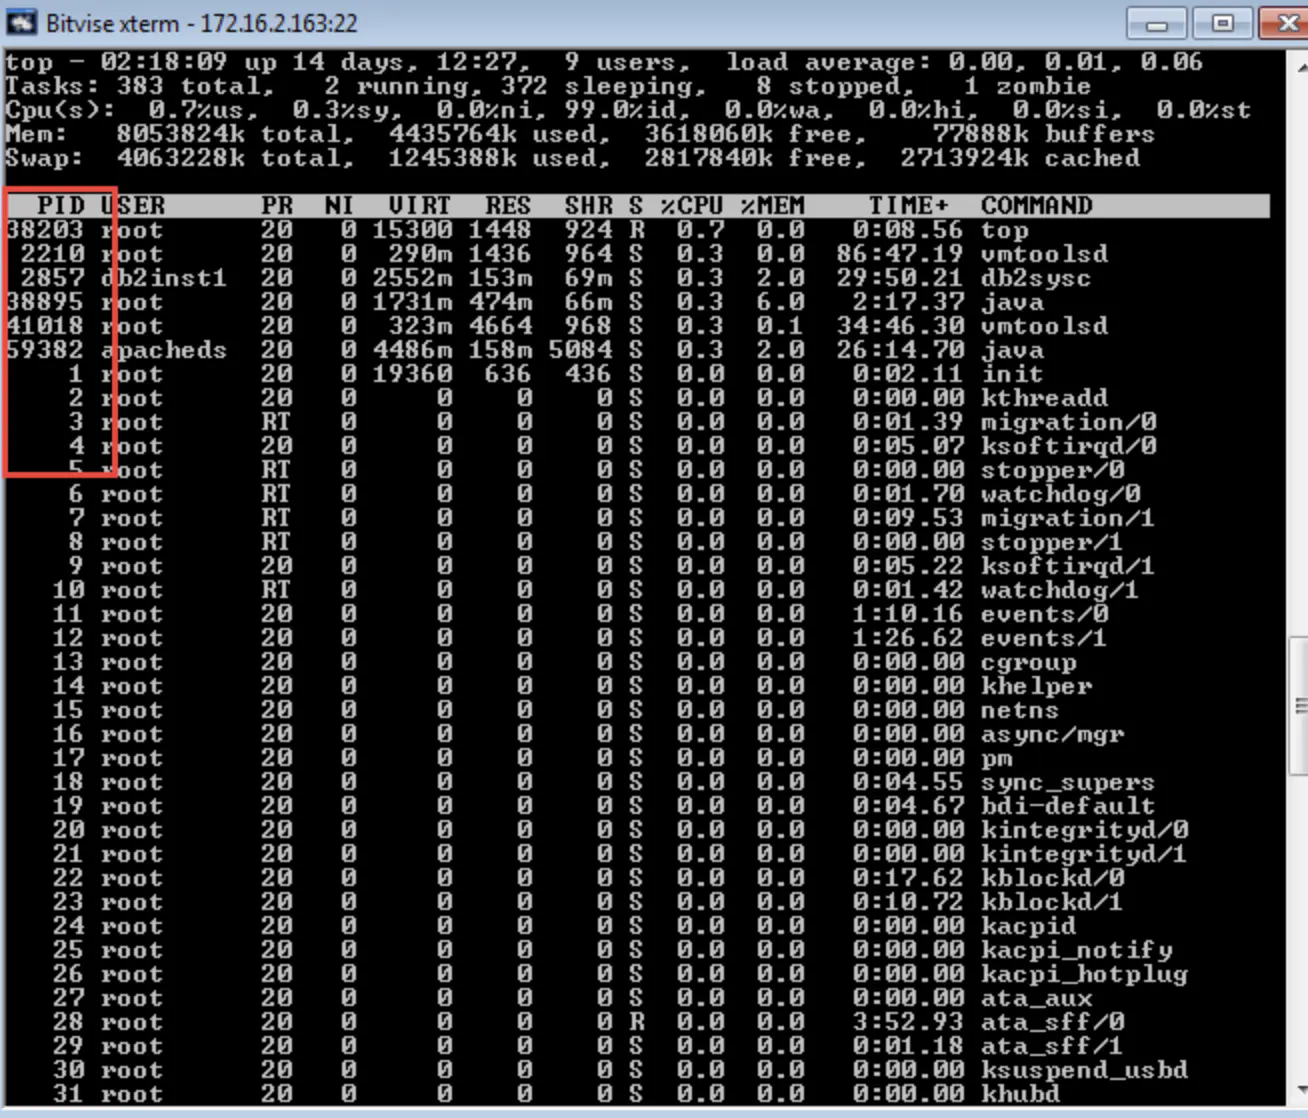
这时,我们需要通过以下的方法来查看进程的详细信息:
Linux在启动一个进程时,系统会在/proc下创建一个以PID命名的文件夹,在该文件夹下会有我们的进程的信息,其中包括一个名为exe的文件即记录了绝对路径,通过ll或ls –l命令即可查看。
ll /proc/PID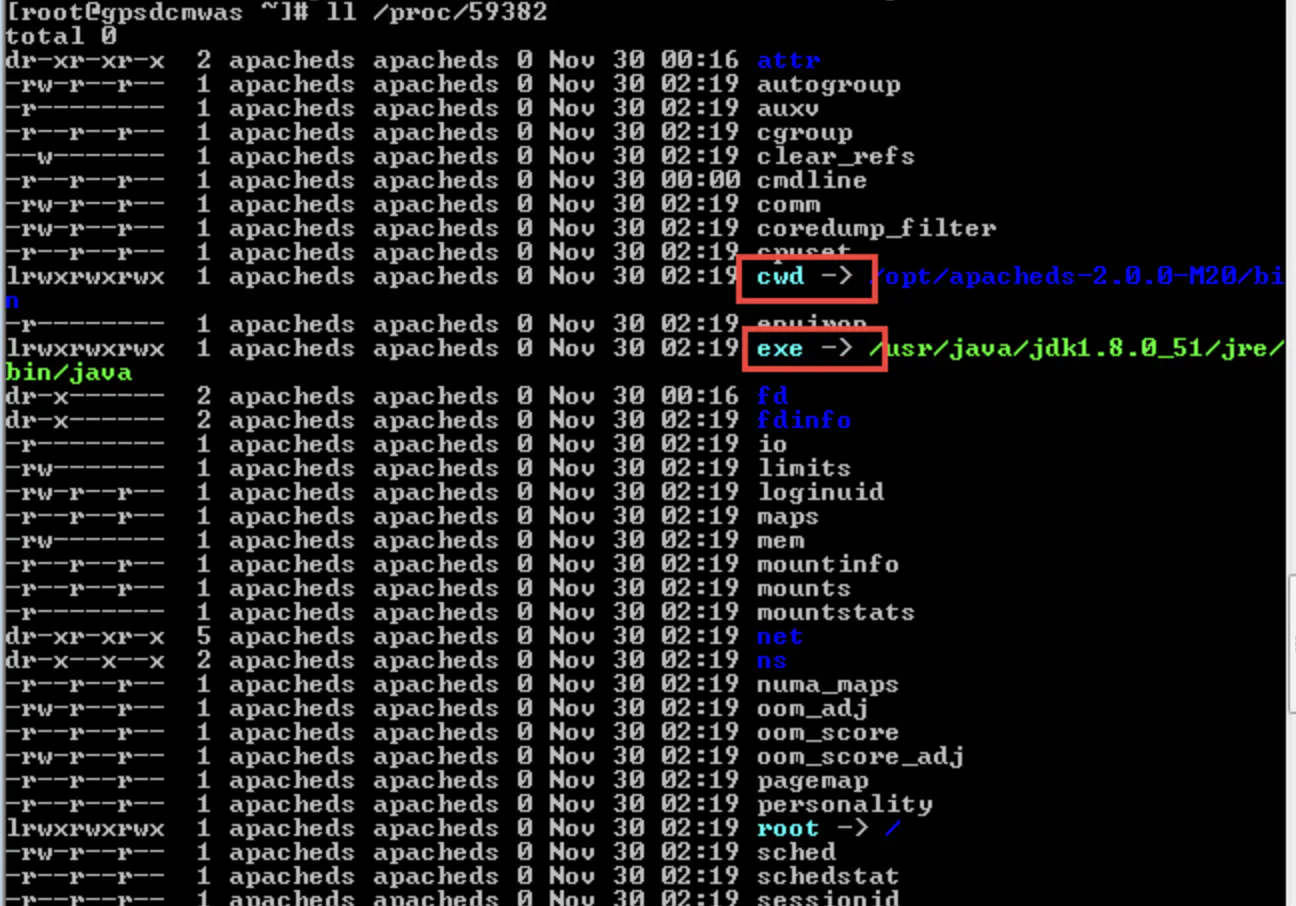
解释
cwd符号链接的是进程运行目录;
exe符号连接就是执行程序的绝对路径;
cmdline就是程序运行时输入的命令行命令;
environ记录了进程运行时的环境变量;
fd目录下是进程打开或使用的文件的符号连接。
https://www.jianshu.com/p/383b998b77d0