话题引入
让我们先简单的看下整个堆年轻代和年老代的垃圾收集器组合(以下配合java8完美支持,其他版本可能稍有不同),其中标红线的则是我们今天要着重讲的内容:
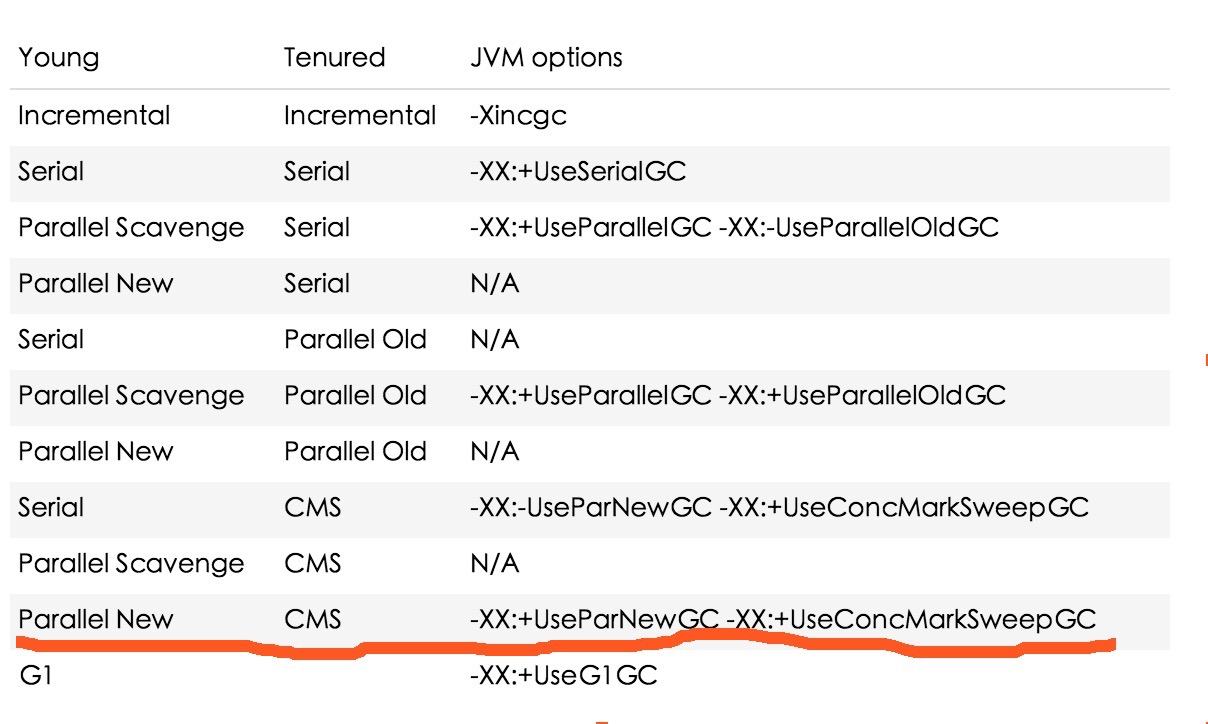
ParNew and CMS
"Concurrent Mark and Sweep" 是CMS的全称,官方给予的名称是:“Mostly Concurrent Mark and Sweep Garbage Collector”;
年轻代:采用 stop-the-world mark-copy 算法;
年老代:采用 Mostly Concurrent mark-sweep 算法;
设计目标:年老代收集的时候避免长时间的暂停;
能够达成该目标主要因为以下两个原因:
1 它不会花时间整理压缩年老代,而是维护了一个叫做 free-lists 的数据结构,该数据结构用来管理那些回收再利用的内存空间;
2 mark-sweep分为多个阶段,其中一大部分阶段GC的工作是和Application threads的工作同时进行的(当然,gc线程会和用户线程竞争CPU的时间),默认的GC的工作线程为你服务器物理CPU核数的1/4;
补充:当你的服务器是多核同时你的目标是低延时,那该GC的搭配则是你的不二选择。
日志
GC日志初体验
首先对整个GC日志有一个大概的认知
2016-08-23T02:23:07.219-0200: 64.322: [GC (Allocation Failure) 64.322: [ParNew: 613404K->68068K(613440K), 0.1020465 secs] 10885349K->10880154K(12514816K), 0.1021309 secs] [Times: user=0.78 sys=0.01, real=0.11 secs]
2016-08-23T02:23:07.321-0200: 64.425: [GC (CMS Initial Mark) [1 CMS-initial-mark: 10812086K(11901376K)] 10887844K(12514816K), 0.0001997 secs] [Times: user=0.00 sys=0.00, real=0.00 secs]
2016-08-23T02:23:07.321-0200: 64.425: [CMS-concurrent-mark-start]
2016-08-23T02:23:07.357-0200: 64.460: [CMS-concurrent-mark: 0.035/0.035 secs] [Times: user=0.07 sys=0.00, real=0.03 secs]
2016-08-23T02:23:07.357-0200: 64.460: [CMS-concurrent-preclean-start]
2016-08-23T02:23:07.373-0200: 64.476: [CMS-concurrent-preclean: 0.016/0.016 secs] [Times: user=0.02 sys=0.00, real=0.02 secs]
2016-08-23T02:23:07.373-0200: 64.476: [CMS-concurrent-abortable-preclean-start]
2016-08-23T02:23:08.446-0200: 65.550: [CMS-concurrent-abortable-preclean: 0.167/1.074 secs] [Times: user=0.20 sys=0.00, real=1.07 secs]
2016-08-23T02:23:08.447-0200: 65.550: [GC (CMS Final Remark) [YG occupancy: 387920 K (613440 K)]65.550: [Rescan (parallel) , 0.0085125 secs]65.559: [weak refs processing, 0.0000243 secs]65.559: [class unloading, 0.0013120 secs]65.560: [scrub symbol table, 0.0008345 secs]65.561: [scrub string table, 0.0001759 secs][1 CMS-remark: 10812086K(11901376K)] 11200006K(12514816K), 0.0110730 secs] [Times: user=0.06 sys=0.00, real=0.01 secs]
2016-08-23T02:23:08.458-0200: 65.561: [CMS-concurrent-sweep-start]
2016-08-23T02:23:08.485-0200: 65.588: [CMS-concurrent-sweep: 0.027/0.027 secs] [Times: user=0.03 sys=0.00, real=0.03 secs]
2016-08-23T02:23:08.485-0200: 65.589: [CMS-concurrent-reset-start]
2016-08-23T02:23:08.497-0200: 65.601: [CMS-concurrent-reset: 0.012/0.012 secs] [Times: user=0.01 sys=0.00, real=0.01 secs]
Minor GC
2016-08-23T02:23:07.219-02001: 64.3222:[GC3(Allocation Failure4) 64.322: [ParNew5: 613404K->68068K6(613440K)7, 0.1020465 secs8] 10885349K->10880154K9(12514816K)10, 0.1021309 secs11][Times: user=0.78 sys=0.01, real=0.11 secs]12
- 2016-08-23T02:23:07.219-0200 – GC发生的时间;
- 64.322 – GC开始,相对JVM启动的相对时间,单位是秒;
- GC – 区别MinorGC和FullGC的标识,这次代表的是MinorGC;
- Allocation Failure – MinorGC的原因,在这个case里边,由于年轻代不满足申请的空间,因此触发了MinorGC;
- ParNew – 收集器的名称,它预示了年轻代使用一个并行的 mark-copy stop-the-world 垃圾收集器;
- 613404K->68068K – 收集前后年轻代的使用情况;
- (613440K) – 整个年轻代的容量;
- 0.1020465 secs – 这个解释用原滋原味的解释:Duration for the collection w/o final cleanup.
- 10885349K->10880154K – 收集前后整个堆的使用情况;
- (12514816K) – 整个堆的容量;
- 0.1021309 secs – ParNew收集器标记和复制年轻代活着的对象所花费的时间(包括和老年代通信的开销、对象晋升到老年代时间、垃圾收集周期结束一些最后的清理对象等的花销);
- [Times: user=0.78 sys=0.01, real=0.11 secs] – GC事件在不同维度的耗时,具体的用英文解释起来更加合理:
- user – Total CPU time that was consumed by Garbage Collector threads during this collection
- sys – Time spent in OS calls or waiting for system event
- real – Clock time for which your application was stopped. With Parallel GC this number should be close to (user time + system time) divided by the number of threads used by the Garbage Collector. In this particular case 8 threads were used. Note that due to some activities not being parallelizable, it always exceeds the ratio by a certain amount.
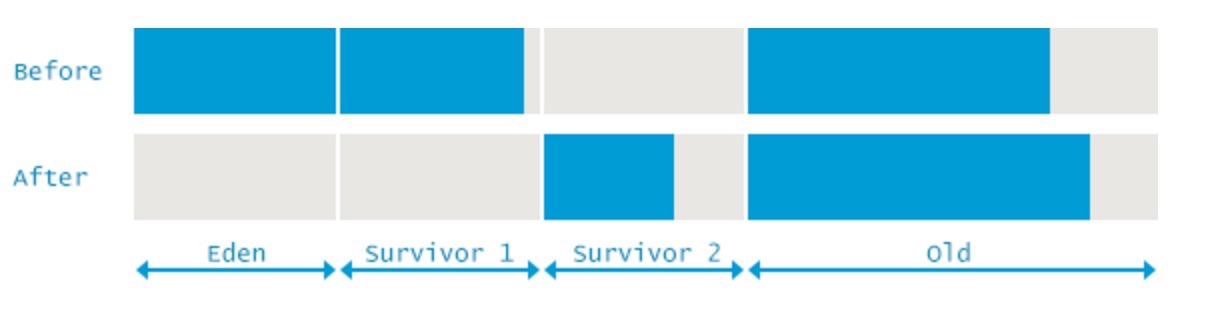
我们来分析下对象晋升问题(原文中的计算方式有问题):
开始的时候:整个堆的大小是 10885349K,年轻代大小是613404K,这说明老年代大小是 10885349-613404=10271945K,
收集完成之后:整个堆的大小是 10880154K,年轻代大小是68068K,这说明老年代大小是 10880154-68068=10812086K,
老年代的大小增加了:10812086-10271945=608209K,也就是说 年轻代到年老代promot了608209K的数据;
图形分析:
Full/Major GC
2016-08-23T11:23:07.321-0200: 64.425: [GC (CMS Initial Mark)1 [1 CMS-initial-mark: 10812086K(11901376K)] 10887844K(12514816K), 0.0001997 secs] [Times: user=0.00 sys=0.00, real=0.00 secs]
2016-08-23T11:23:07.321-0200: 64.425: [CMS-concurrent-mark-start]
2016-08-23T11:23:07.357-0200: 64.460: [CMS-concurrent-mark2: 0.035/0.035 secs] [Times: user=0.07 sys=0.00, real=0.03 secs]
2016-08-23T11:23:07.357-0200: 64.460: [CMS-concurrent-preclean-start]
2016-08-23T11:23:07.373-0200: 64.476: [CMS-concurrent-preclean3: 0.016/0.016 secs] [Times: user=0.02 sys=0.00, real=0.02 secs]
2016-08-23T11:23:07.373-0200: 64.476: [CMS-concurrent-abortable-preclean-start]
2016-08-23T11:23:08.446-0200: 65.550: [CMS-concurrent-abortable-preclean4: 0.167/1.074 secs] [Times: user=0.20 sys=0.00, real=1.07 secs]
2016-08-23T11:23:08.447-0200: 65.550: [GC (CMS Final Remark5)
[YG occupancy: 387920 K (613440 K)]65.550: [Rescan (parallel) , 0.0085125 secs]65.559:
[weak refs processing, 0.0000243 secs]65.559: [class unloading, 0.0013120 secs]65.560:
[scrub symbol table, 0.0008345 secs]65.561: [scrub string table, 0.0001759 secs][1 CMS-remark: 10812086K(11901376K)] 11200006K(12514816K), 0.0110730 secs]
[Times: user=0.06 sys=0.00, real=0.01 secs]
2016-08-23T11:23:08.458-0200: 65.561: [CMS-concurrent-sweep-start]
2016-08-23T11:23:08.485-0200: 65.588: [CMS-concurrent-sweep6: 0.027/0.027 secs] [Times: user=0.03 sys=0.00, real=0.03 secs]
2016-08-23T11:23:08.485-0200: 65.589: [CMS-concurrent-reset-start]
2016-08-23T11:23:08.497-0200: 65.601: [CMS-concurrent-reset7: 0.012/0.012 secs] [Times: user=0.01 sys=0.00, real=0.01 secs]
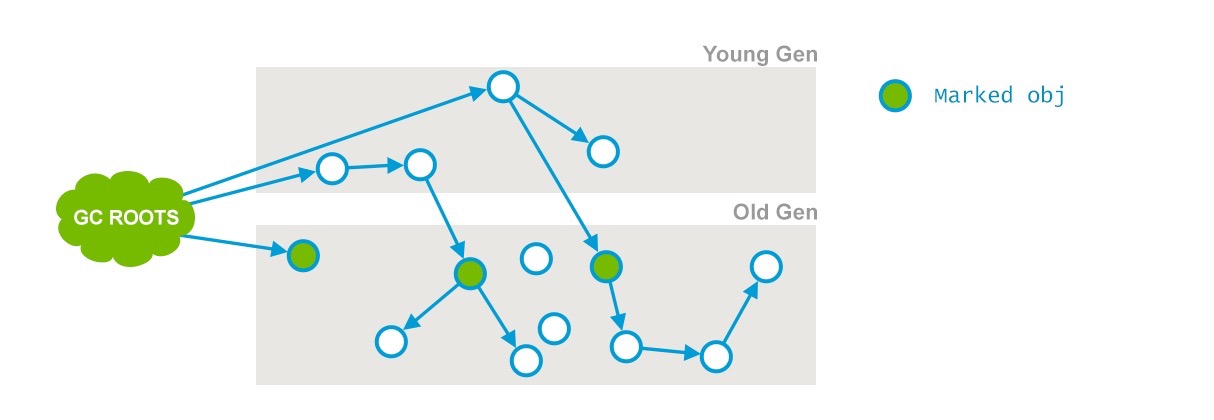
Phase 1: Initial Mark
这是CMS中两次stop-the-world事件中的一次。它有两个目标:一是标记老年代中所有的GC Roots;二是标记被年轻代中活着的对象引用的对象。
标记结果如下:
分析:
2016-08-23T11:23:07.321-0200: 64.421: [GC (CMS Initial Mark2[1 CMS-initial-mark: 10812086K3(11901376K)4] 10887844K5(12514816K)6, 0.0001997 secs] [Times: user=0.00 sys=0.00, real=0.00 secs]7
- 016-08-23T11:23:07.321-0200: 64.42 – GC事件开始,包括时钟时间和相对JVM启动时候的相对时间,下边所有的阶段改时间的含义相同;
- CMS Initial Mark – 收集阶段,开始收集所有的GC Roots和直接引用到的对象;
- 10812086K – 当前老年代使用情况;
- (11901376K) – 老年代可用容量;
- 10887844K – 当前整个堆的使用情况;
- (12514816K) – 整个堆的容量;
- 0.0001997 secs] [Times: user=0.00 sys=0.00, real=0.00 secs] – 时间计量;
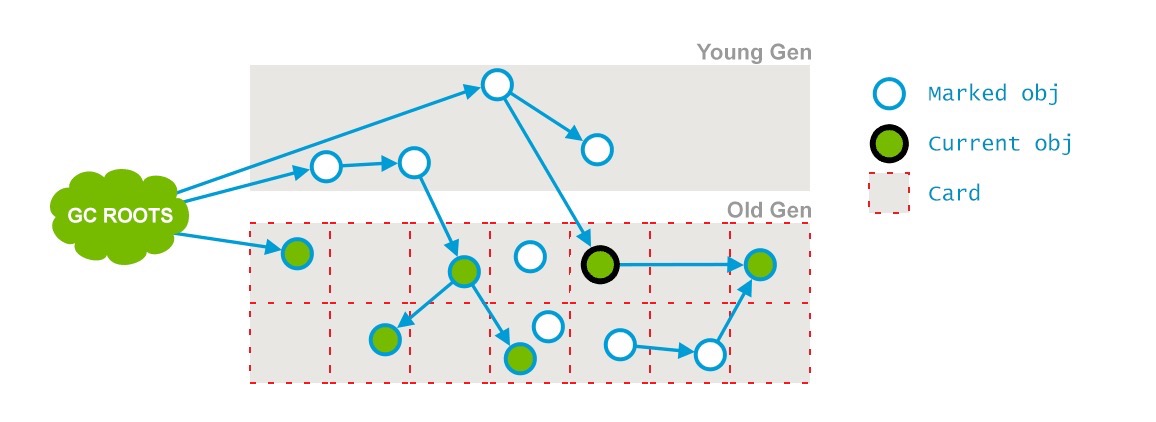
Phase 2: Concurrent Mark
这个阶段会遍历整个老年代并且标记所有存活的对象,从“初始化标记”阶段找到的GC Roots开始。并发标记的特点是和应用程序线程同时运行。并不是老年代的所有存活对象都会被标记,因为标记的同时应用程序会改变一些对象的引用等。
标记结果如下:
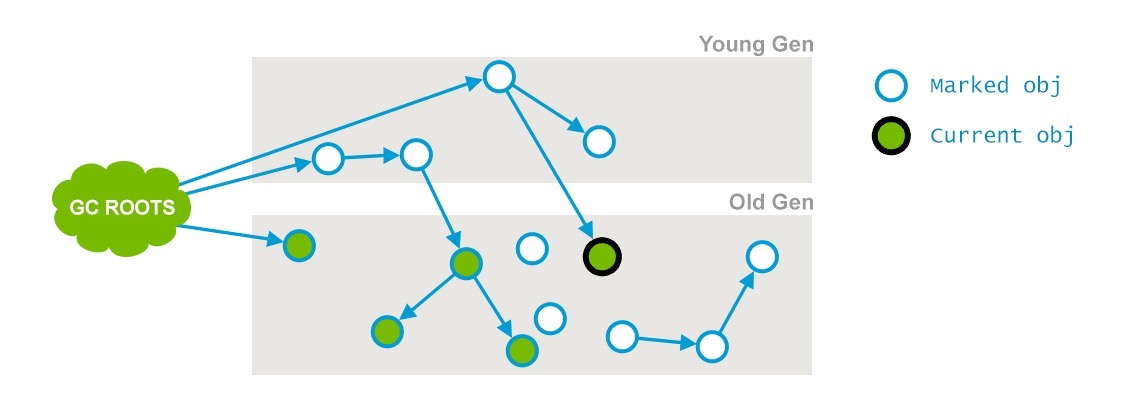
在上边的图中,一个引用的箭头已经远离了当前对象(current obj)
分析:
2016-08-23T11:23:07.321-0200: 64.425: [CMS-concurrent-mark-start]
2016-08-23T11:23:07.357-0200: 64.460: [CMS-concurrent-mark1: 035/0.035 secs2] [Times: user=0.07 sys=0.00, real=0.03 secs]3
- CMS-concurrent-mark – 并发收集阶段,这个阶段会遍历整个年老代并且标记活着的对象;
- 035/0.035 secs – 展示该阶段持续的时间和时钟时间;
- [Times: user=0.07 sys=0.00, real=0.03 secs] – 同上
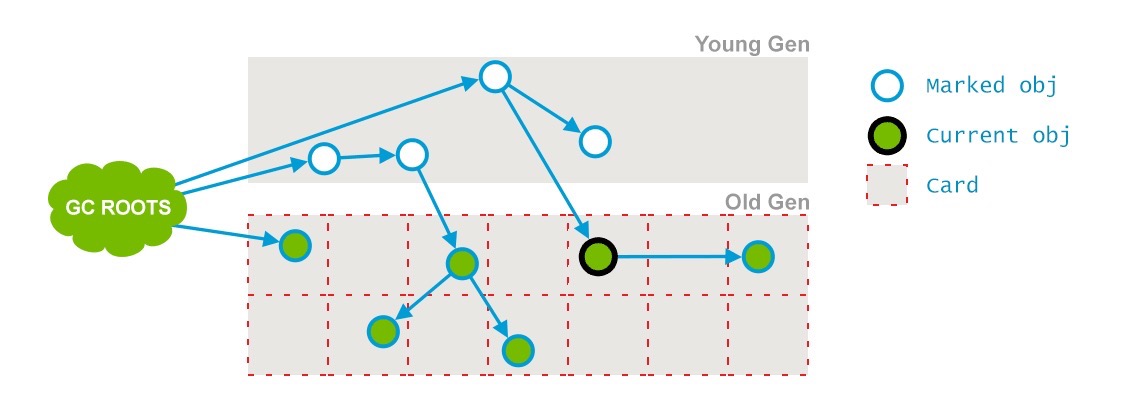
Phase 3: Concurrent Preclean
这个阶段又是一个并发阶段,和应用线程并行运行,不会中断他们。前一个阶段在并行运行的时候,一些对象的引用已经发生了变化,当这些引用发生变化的时候,JVM会标记堆的这个区域为Dirty Card(包含被标记但是改变了的对象,被认为"dirty"),这就是 Card Marking。
如下图:

在pre-clean阶段,那些能够从dirty card对象到达的对象也会被标记,这个标记做完之后,dirty card标记就会被清除了,如下:
另外,一些必要的清扫工作也会做,还会做一些final remark阶段需要的准备工作;
分析
2016-08-23T11:23:07.357-0200: 64.460: [CMS-concurrent-preclean-start]
2016-08-23T11:23:07.373-0200: 64.476: [CMS-concurrent-preclean1: 0.016/0.016 secs2] [Times: user=0.02 sys=0.00, real=0.02 secs]3
- CMS-concurrent-preclean – 这个阶段负责前一个阶段标记了又发生改变的对象标记;
- 0.016/0.016 secs – 展示该阶段持续的时间和时钟时间;
- [Times: user=0.02 sys=0.00, real=0.02 secs] – 同上
Phase 4: Concurrent Abortable Preclean
又一个并发阶段不会停止应用程序线程。这个阶段尝试着去承担STW的Final Remark阶段足够多的工作。这个阶段持续的时间依赖好多的因素,由于这个阶段是重复的做相同的事情直到发生aboart的条件(比如:重复的次数、多少量的工作、持续的时间等等)之一才会停止。
2016-08-23T11:23:07.373-0200: 64.476: [CMS-concurrent-abortable-preclean-start]
2016-08-23T11:23:08.446-0200: 65.550: [CMS-concurrent-abortable-preclean1: 0.167/1.074 secs2] [Times: user=0.20 sys=0.00, real=1.07 secs]3
- CMS-concurrent-abortable-preclean – 可终止的并发预清理;
- 0.167/1.074 secs – 展示该阶段持续的时间和时钟时间(It is interesting to note that the user time reported is a lot smaller than clock time. Usually we have seen that real time is less than user time, meaning that some work was done in parallel and so elapsed clock time is less than used CPU time. Here we have a little amount of work – for 0.167 seconds of CPU time, and garbage collector threads were doing a lot of waiting. Essentially, they were trying to stave off for as long as possible before having to do an STW pause. By default, this phase may last for up to 5 seconds);
- [Times: user=0.20 sys=0.00, real=1.07 secs] – 同上
这个阶段很大程度的影响着即将来临的Final Remark的停顿,有相当一部分重要的 configuration options 和 失败的模式;
Phase 5: Final Remark
这个阶段是CMS中第二个并且是最后一个STW的阶段。该阶段的任务是完成标记整个年老代的所有的存活对象。由于之前的预处理是并发的,它可能跟不上应用程序改变的速度,这个时候,STW是非常需要的来完成这个严酷考验的阶段。
通常CMS尽量运行Final Remark阶段在年轻代是足够干净的时候,目的是消除紧接着的连续的几个STW阶段。
分析:
2016-08-23T11:23:08.447-0200: 65.5501: [GC (CMS Final Remark2) [YG occupancy: 387920 K (613440 K)3]65.550: [Rescan (parallel) , 0.0085125 secs]465.559: [weak refs processing, 0.0000243 secs]65.5595: [class unloading, 0.0013120 secs]65.5606: [scrub string table, 0.0001759 secs7][1 CMS-remark: 10812086K(11901376K)8] 11200006K(12514816K) 9, 0.0110730 secs10] [[Times: user=0.06 sys=0.00, real=0.01 secs]11
- 2016-08-23T11:23:08.447-0200: 65.550 – 同上;
- CMS Final Remark – 收集阶段,这个阶段会标记老年代全部的存活对象,包括那些在并发标记阶段更改的或者新创建的引用对象;
- YG occupancy: 387920 K (613440 K) – 年轻代当前占用情况和容量;
- [Rescan (parallel) , 0.0085125 secs] – 这个阶段在应用停止的阶段完成存活对象的标记工作;
- weak refs processing, 0.0000243 secs]65.559 – 第一个子阶段,随着这个阶段的进行处理弱引用;
- class unloading, 0.0013120 secs]65.560 – 第二个子阶段(that is unloading the unused classes, with the duration and timestamp of the phase);
- scrub string table, 0.0001759 secs – 最后一个子阶段(that is cleaning up symbol and string tables which hold class-level metadata and internalized string respectively)
- 10812086K(11901376K) – 在这个阶段之后老年代占有的内存大小和老年代的容量;
- 11200006K(12514816K) – 在这个阶段之后整个堆的内存大小和整个堆的容量;
- 0.0110730 secs – 这个阶段的持续时间;
- [Times: user=0.06 sys=0.00, real=0.01 secs] – 同上;
通过以上5个阶段的标记,老年代所有存活的对象已经被标记并且现在要通过Garbage Collector采用清扫的方式回收那些不能用的对象了。
Phase 6: Concurrent Sweep
和应用线程同时进行,不需要STW。这个阶段的目的就是移除那些不用的对象,回收他们占用的空间并且为将来使用。
如图:
分析:
2016-08-23T11:23:08.458-0200: 65.561: [CMS-concurrent-sweep-start] 2016-08-23T11:23:08.485-0200: 65.588: [CMS-concurrent-sweep1: 0.027/0.027 secs2] [[Times: user=0.03 sys=0.00, real=0.03 secs] 3
- CMS-concurrent-sweep – 这个阶段主要是清除那些没有标记的对象并且回收空间;
- 0.027/0.027 secs – 展示该阶段持续的时间和时钟时间;
- [Times: user=0.03 sys=0.00, real=0.03 secs] – 同上
Phase 7: Concurrent Reset
这个阶段并发执行,重新设置CMS算法内部的数据结构,准备下一个CMS生命周期的使用。
2016-08-23T11:23:08.485-0200: 65.589: [CMS-concurrent-reset-start] 2016-08-23T11:23:08.497-0200: 65.601: [CMS-concurrent-reset1: 0.012/0.012 secs2] [[Times: user=0.01 sys=0.00, real=0.01 secs]3
- CMS-concurrent-reset – 这个阶段重新设置CMS算法内部的数据结构,为下一个收集阶段做准备;
- 0.012/0.012 secs – 展示该阶段持续的时间和时钟时间;
- [Times: user=0.01 sys=0.00, real=0.01 secs] – 同上
参考资料
https://plumbr.eu/handbook/garbage-collection-algorithms-implementations#concurrent-mark-and-sweep
http://www.cnblogs.com/zhangxiaoguang/p/5792468.html
"Allocation Failure" is a cause of GC cycle to kick.
"Allocation Failure" means that no more space left in Eden to allocate object. So, it is normal cause of young GC.
Older JVM were not printing GC cause for minor GC cycles.
"Allocation Failure" is almost only possible cause for minor GC. Another reason for minor GC to kick could be CMS remark phase (if +XX:+ScavengeBeforeRemark is enabled).
https://stackoverflow.com/questions/28342736/java-gc-allocation-failure
本文主要分析一个频繁GC (Allocation Failure)及young gc时间过长的case。
症状
- gc throughput percent逐步下降,从一般的99.96%逐步下降,跌破99%,进入98%,最低点能到94%
- young gc time逐步增加,从一般的十几毫秒逐步上升,突破50,再突破100,150,200,250
- 在8.5天的时间内,发生了9000多次gc,其中full gc为4次,平均将近8秒,大部分是young gc(
allocation failure为主),平均270多毫秒,最大值将近7秒 - 平均对象创建速率为10.63 mb/sec,平均的晋升速率为2 kb/sec,cpu使用率正常,没有明显的飙升
jvm参数
-XX:+UseParallelGC -XX:+UseParallelOldGC -XX:ParallelGCThreads=4 -XX:+UseAdaptiveSizePolicy -XX:MaxHeapSize=2147483648 -XX:MaxNewSize=1073741824 -XX:NewSize=1073741824 -XX:+PrintGCDetails -XX:+PrintTenuringDistribution -XX:+PrintGCTimeStamps
复制代码
jdk版本
java -version
java version "1.8.0_66"
Java(TM) SE Runtime Environment (build 1.8.0_66-b17)
Java HotSpot(TM) 64-Bit Server VM (build 25.66-b17, mixed mode)
复制代码
full gc
27.066: [Full GC (Metadata GC Threshold) [PSYoungGen: 19211K->0K(917504K)] [ParOldGen: 80K->18440K(1048576K)] 19291K->18440K(1966080K), [Metaspace: 20943K->20943K(1069056K)], 0.5005658 secs] [Times: user=0.24 sys=0.01, real=0.50 secs]
100.675: [Full GC (Metadata GC Threshold) [PSYoungGen: 14699K->0K(917504K)] [ParOldGen: 18464K->23826K(1048576K)] 33164K->23826K(1966080K), [Metaspace: 34777K->34777K(1081344K)], 0.7937738 secs] [Times: user=0.37 sys=0.01, real=0.79 secs]
195.073: [Full GC (Metadata GC Threshold) [PSYoungGen: 24843K->0K(1022464K)] [ParOldGen: 30048K->44782K(1048576K)] 54892K->44782K(2071040K), [Metaspace: 58220K->58220K(1101824K)], 3.7936515 secs] [Times: user=1.86 sys=0.02, real=3.79 secs]
242605.669: [Full GC (Ergonomics) [PSYoungGen: 67276K->0K(882688K)] [ParOldGen: 1042358K->117634K(1048576K)] 1109635K->117634K(1931264K), [Metaspace: 91365K->90958K(1132544K)], 22.1573804 secs] [Times: user=2.50 sys=3.51, real=22.16 secs]
复制代码
可以发现发生的4次full gc,前三次都是由于Metadata GC Threshold造成的,只有最后一次是由于Ergonomics引发的。
Full GC (Metadata GC Threshold)
这里使用的是java8,参数没有明确指定metaspace的大小和上限,查看一下
jstat -gcmetacapacity 7
   MCMN       MCMX        MC       CCSMN      CCSMX       CCSC     YGC   FGC    FGCT     GCT
       0.0  1136640.0    99456.0        0.0  1048576.0    12160.0 38009    16  275.801 14361.992
复制代码- 忽略后面的FGC,因为分析的日志只是其中四分之一
- 这里可以看到MCMX(Maximum metaspace capacity (kB))有一个多G,而MC(Metaspace capacity (kB))才97M左右,为啥会引起Full GC (Metadata GC Threshold)
相关参数
- -XX:MetaspaceSize,初始空间大小(也是初始的阈值,即初始的high-water-mark),达到该值就会触发垃圾收集进行类型卸载,同时GC会对该值进行调整:如果释放了大量的空间,就适当降低该值;如果释放了很少的空间,那么在不超过MaxMetaspaceSize时,适当提高该值。
- -XX:MaxMetaspaceSize,最大空间,默认是没有限制的,取决于本地系统空间容量。
- -XX:MinMetaspaceFreeRatio,在GC之后,最小的Metaspace剩余空间容量的百分比(
即元数据在当前分配大小的最大占用大小),如果空闲比小于这个参数(即超过了最大占用大小),那么将对meta space进行扩容。 - -XX:MaxMetaspaceFreeRatio,在GC之后,最大的Metaspace剩余空间容量的百分比(
即元数据在当前分配大小的最小占用大小),如果空闲比大于这个参数(即小于最小占用大小),那么将对meta space进行缩容.
由于没有设置,在机器上的默认值为:
java -XX:+PrintFlagsFinal | grep Meta
    uintx InitialBootClassLoaderMetaspaceSize       = 4194304                             {product}
    uintx MaxMetaspaceExpansion                     = 5451776                             {product}
    uintx MaxMetaspaceFreeRatio                     = 70                                  {product}
    uintx MaxMetaspaceSize                          = 18446744073709547520                    {product}
    uintx MetaspaceSize                             = 21807104                            {pd product}
    uintx MinMetaspaceExpansion                     = 339968                              {product}
    uintx MinMetaspaceFreeRatio                     = 40                                  {product}
     bool TraceMetadataHumongousAllocation          = false                               {product}
     bool UseLargePagesInMetaspace                  = false                               {product}
复制代码
可以看到MinMetaspaceFreeRatio为40,MaxMetaspaceFreeRatio为70,MetaspaceSize为20M,Full GC (Metadata GC Threshold)主要分为了三次
- 第一次,[Metaspace: 20943K->20943K(1069056K)]
- 第二次,[Metaspace: 34777K->34777K(1081344K)]
- 第三次,[Metaspace: 58220K->58220K(1101824K)]
可以看到metaspace的阈值不断动态调整,至于具体调整的逻辑,官方文档貌似没讲,这里暂时不深究。只要没有超过Max值就没有致命影响,但是对于低延时的应用来讲,是要尽量避免动态调整引起的gc耗时,可以根据调优计算并设置初始阈值来解决。
Full GC (Ergonomics)
这里可以到full gc的reason是Ergonomics,是因为开启了UseAdaptiveSizePolicy,jvm自己进行自适应调整引发的full gc
GC (Allocation Failure)
分析完full gc之后我们看下young gc,看log里头99%都是GC (Allocation Failure)造成的young gc。Allocation Failure表示向young generation(eden)给新对象申请空间,但是young generation(eden)剩余的合适空间不够所需的大小导致的minor gc。
-XX:+PrintTenuringDistribution
Desired survivor size 75497472 bytes, new threshold 2 (max 15)
- age   1:   68407384 bytes,   68407384 total
- age   2:   12494576 bytes,   80901960 total
- age   3:      79376 bytes,   80981336 total
- age   4:    2904256 bytes,   83885592 total
复制代码- 这个Desired survivor size表示survivor区域允许容纳的最大空间大小为75497472 bytes
- 下面的对象列表为此次gc之后,survivor当前存活对象的年龄大小分布,total大小为83885592 > 75497472,而age1大小为68407384 < 75497472,因此new threshold变为2(
作用于下次gc)。下次gc如果对象没释放的话,超过阈值的对象将晋升到old generation。
age list为空
59.463: [GC (Allocation Failure)
Desired survivor size 134217728 bytes, new threshold 7 (max 15)
[PSYoungGen: 786432K->14020K(917504K)] 804872K->32469K(1966080K), 0.1116049 secs] [Times: user=0.10 sys=0.01, real=0.20 secs]
复制代码
这里Desired survivor size这行下面并没有各个age对象的分布,那就表示此次gc之后,当前survivor区域并没有age小于max threshold的存活对象。而这里一个都没有输出,表示此次gc回收对象之后,没有存活的对象可以拷贝到新的survivor区。
gc之后survivor有对象的例子
jstat -gcutil -h10 7 10000 10000
  S0     S1     E      O      M     CCS    YGC     YGCT    FGC    FGCT     GCT
  0.00  99.99  90.38  29.82  97.84  96.99    413  158.501     4   14.597  173.098
 11.60   0.00  76.00  29.83  97.84  96.99    414  158.511     4   14.597  173.109
 11.60   0.00  77.16  29.83  97.84  96.99    414  158.511     4   14.597  173.109
  0.00  13.67  60.04  29.83  97.84  96.99    415  158.578     4   14.597  173.176
  0.00  13.67  61.05  29.83  97.84  96.99    415  158.578     4   14.597  173.176
复制代码- 在ygc之前young generation = eden + S1;ygc之后,young generation = eden + S0
- 观察可以看到ygc之后old generation空间没变,表示此次ygc,没有对象晋升到old generation。
- gc之后,存活对象搬移到了另外一个survivor区域
- 这里由于是每个10秒采样一次,存在延迟,即gc之后,立马有新对象在eden区域分配了,因此这里看到的eden区域有对象占用。
real time > usr time + sys time
722914.974: [GC (Allocation Failure)
Desired survivor size 109576192 bytes, new threshold 15 (max 15)
[PSYoungGen: 876522K->8608K(941568K)] 1526192K->658293K(1990144K), 0.0102709 secs] [Times: user=0.03 sys=0.00, real=0.01 secs]
722975.207: [GC (Allocation Failure)
Desired survivor size 103284736 bytes, new threshold 15 (max 15)
[PSYoungGen: 843168K->39278K(941568K)] 1492853K->688988K(1990144K), 0.3607036 secs] [Times: user=0.17 sys=0.00, real=0.36 secs]
复制代码
里头有大于将近300次的gc的real time时间大于usr time + sys time。
- real:指的是操作从开始到结束所经过的墙钟时间(WallClock Time)
- user:指的是用户态消耗的CPU时间;
- sys:指的是内核态消耗的CPU时间。
墙钟时间包括各种非运算的等待耗时,例如等待磁盘I/O、等待线程阻塞,而CPU时间不包括这些耗时,但当系统有多CPU或者多核的话,多线程操作会叠加这些CPU时间,所以看到user或sys时间超过real时间是完全正常的。
user + sys 就是CPU花费的实际时间,注意这个值统计了所有CPU上的时间,如果进程工作在多线程的环境下,叠加了多线程的时间,这个值是会超出 real 所记录的值的,即 user + sys >= real 。
这里300多次real time时间大于usr time + sys time,表明可能有两个问题,一个是IO操作密集,另一个是cpu(
分配)的额度不够。
新生代垃圾回收机制
- 新对象尝试栈上分配,不行再尝试TLAB分配,不行则考虑是否直接绕过eden区在年老代分配空间(
-XX:PretenureSizeThreshold设置大对象直接进入年老代的阈值,当对象大小超过这个值时,将直接在年老代分配。),不行则最后考虑在eden申请空间 - 向eden申请空间创建新对象,eden没有合适的空间,因此触发minor gc
- minor gc将eden区及from survivor区域的存活对象进行处理
- 如果这些对象年龄达到阈值,则直接晋升到年老代
- 若要拷贝的对象太大,那么不会拷贝到to survivor,而是直接进入年老代
- 若to survivor区域空间不够/或者复制过程中出现不够,则发生survivor溢出,直接进入年老代
- 其他的,若to survivor区域空间够,则存活对象拷贝到to survivor区域
- 此时eden区及from survivor区域的剩余对象为垃圾对象,直接抹掉回收,释放的空间成为新的可分配的空间
- minor gc之后,若eden空间足够,则新对象在eden分配空间;若eden空间仍然不够,则新对象直接在年老代分配空间
小结
从上面的分析可以看出,young generation貌似有点大,ygc时间长;另外每次ygc之后survivor空间基本是空的,说明新生对象产生快,生命周期也短,原本设计的survivor空间没有派上用场。因此可以考虑缩小下young generation的大小,或者改为G1试试。
关于-XX:+PrintTenuringDistribution有几个要点,要明确一下:
- 这个打印的哪个区域的对象分布(
survivor) - 是在gc之前打印,还是在gc之后打印(
gc之后打印) - 一个新生对象第一次到survivor时其age算0还是算1
对象的年龄就是他经历的MinorGC次数,对象首次分配时,年龄为0,第一次经历MinorGC之后,若还没有被回收,则年龄+1,由于是第一次经历MinorGC,因此进入survivor区。因此对象第一次进入survivor区域的时候年龄为1.
- 晋升阈值(new threshold)动态调整
如果底下age的total大小大于Desired survivor size的大小,那么就代表了survivor空间溢出了,被填满,然后会重新计算threshold。
作者:go4it
链接:https://juejin.im/post/5a9b811a6fb9a028e46e1c88
来源:掘金
著作权归作者所有。商业转载请联系作者获得授权,非商业转载请注明出处。
Understanding Garbage Collection Logs
This post is the last teaser before we publish the Plumbr GC handbook next week. In this post, we will review how garbage collector logs look like and what useful information one can obtain from them. For this purpose, we have turned on GC logging for a JVM running with -XX:+UseSerialGC by using the following startup parameters:
-XX:+PrintGCDetails -XX:+PrintGCDateStamps -XX:+PrintGCTimeStamps
This resulted in the output similar to following:
2015-05-26T14:45:37.987-0200: 151.126: [GC (Allocation Failure) 151.126: [DefNew: 629119K->69888K(629120K), 0.0584157 secs] 1619346K->1273247K(2027264K), 0.0585007 secs] [Times: user=0.06 sys=0.00, real=0.06 secs]
2015-05-26T14:45:59.690-0200: 172.829: [GC (Allocation Failure) 172.829: [DefNew: 629120K->629120K(629120K), 0.0000372 secs]172.829: [Tenured: 1203359K->755802K(1398144K), 0.1855567 secs] 1832479K->755802K(2027264K), [Metaspace: 6741K->6741K(1056768K)], 0.1856954 secs] [Times: user=0.18 sys=0.00, real=0.18 secs]
The above short snippet from the GC logs exposes a lot of information about what is going on inside the JVM. As a matter of fact, in this snippet there were two Garbage Collection events taking place, one of them cleaning Young generation and the other one taking care of entire heap. Lets look at the first one of these events, a minor GC, taking place in Young generation:
2015-05-26T14:45:37.987-02001:151.1262:[GC3(Allocation Failure4) 151.126: [DefNew5:629119K->69888K6(629120K)7, 0.0584157 secs]1619346K->1273247K8(2027264K)9,0.0585007 secs10][Times: user=0.06 sys=0.00, real=0.06 secs]11
- 2015-05-26T14:45:37.987-0200 – Time when the GC event started.
- 151.126 – Time when the GC event started, relative to the JVM startup time. Measured in seconds.
- GC – Flag to distinguish between Minor & Full GC. This time it is indicating that this was a Minor GC.
- Allocation Failure – Cause of the collection. In this case, the GC is triggered due to a data structure not fitting into any region in Young Generation.
- DefNew – Name of the garbage collector used. This cryptic name stands for the single-threaded mark-copy stop-the-world garbage collector used to clean Young generation.
- 629119K->69888K – Usage of Young generation before and after collection.
- (629120K) – Total size of the Young generation.
- 1619346K->1273247K – Total used heap before and after collection.
- (2027264K) – Total available heap.
- 0.0585007 secs – Duration of the GC event in seconds.
- [Times: user=0.06 sys=0.00, real=0.06 secs] – Duration of the GC event, measured in different categories:
- user – Total CPU time that was consumed by Garbage Collector threads during this collection
- sys – Time spent in OS calls or waiting for system event
- real – Clock time for which your application was stopped. As Serial Garbage Collectoralways uses just a single thread, real time is thus equal to the sum of user and system times.
From the above snippet we can understand exactly what was happening with memory consumption inside the JVM during the GC event. Before this collection heap usage totaled at 1,619,346K. Out of this amount, the Young generation consumed 629,119K. From this we can calculate the Old generation usage being equal to 990,227K.
A more important conclusion is hidden in the next batch of numbers, indicating that after the collection young generation usage decreased by 559,231K, but total heap usage decreased only by 346,099K. From this we can again derive that 213,132K of objects had been promoted from Young generation to Old.
This GC event can be illustrated with the following snapshots depicting memory usage right before the GC started and right after it finished:

If you found the content to be useful, check out the entire Java Garbage Collection Handbook where this example was extracted from.
https://plumbr.io/blog/garbage-collection/understanding-garbage-collection-logs