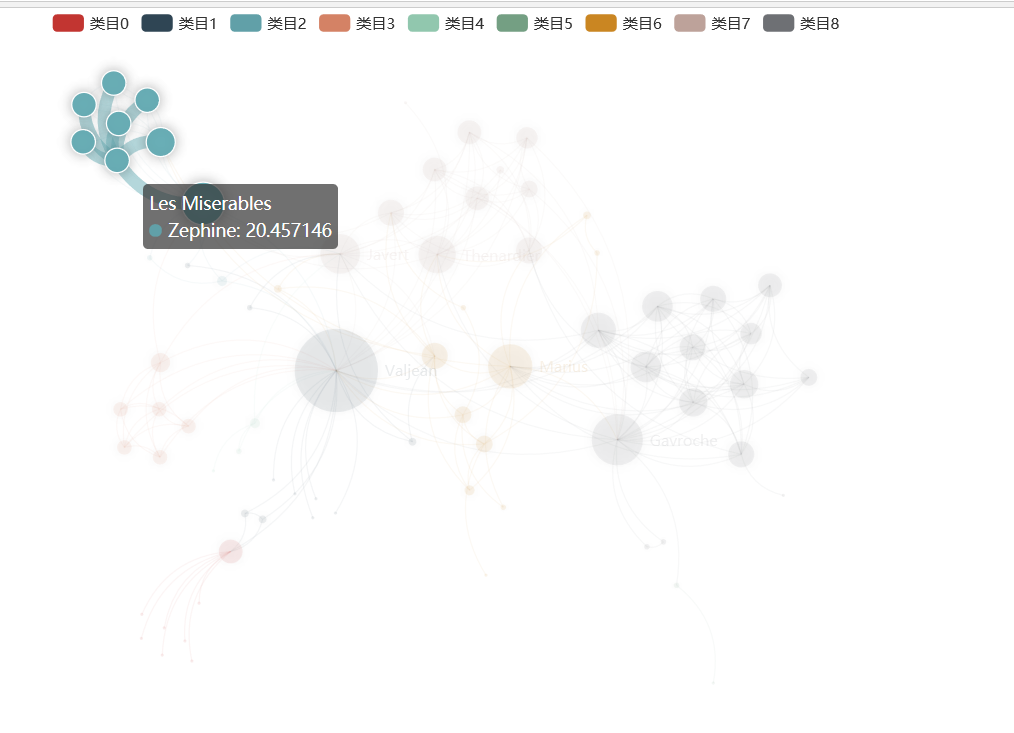
关系图:
代码:


 1 <!DOCTYPE html>
 2 <head>
 3     <meta charset="utf-8">
 4     <script type="text/javascript" src="js/echarts.js"></script>
 5     <script type="text/javascript" src="js/jquery-3.3.1.js"></script>
 6     <script type="text/javascript" src="js/dataTool.js"></script>
 7 </head>
 8 <body style="height: 600px; margin: 0">
 9 <div id="container" style="height: 100%"></div>
10 <script type="text/javascript">
11     var dom = document.getElementById("container");
12     var myChart = echarts.init(dom);
13     var app = {};
14     option = null;
15     myChart.showLoading();
16     $.get('data/les-miserables.gexf', function (xml) {
17         myChart.hideLoading();
18
19         var graph = echarts.dataTool.gexf.parse(xml);
20         var categories = [];
21         for (var i = 0; i < 9; i++) {
22             categories[i] = {
23                 name: '类目' + i
24             };
25         }
26         graph.nodes.forEach(function (node) {
27             node.itemStyle = null;
28             node.value = node.symbolSize;
29             node.symbolSize /= 1.5;
30             node.label = {
31                 normal: {
32                     show: node.symbolSize > 30
33                 }
34             };
35             node.category = node.attributes.modularity_class;
36         });
37         option = {
38             title: {
39                 text: 'Les Miserables',
40                 subtext: 'Default layout',
41                 top: 'bottom',
42                 left: 'right'
43             },
44             tooltip: {},
45             legend: [{
46                 // selectedMode: 'single',
47                 data: categories.map(function (a) {
48                     return a.name;
49                 })
50             }],
51             animationDuration: 1500,
52             animationEasingUpdate: 'quinticInOut',
53             series : [
54                 {
55                     name: 'Les Miserables',
56                     type: 'graph',
57                     layout: 'none',
58                     data: graph.nodes,
59                     links: graph.links,
60                     categories: categories,
61                     roam: true,
62                     focusNodeAdjacency: true,
63                     itemStyle: {
64                         normal: {
65                             borderColor: '#fff',
66                             borderWidth: 1,
67                             shadowBlur: 10,
68                             shadowColor: 'rgba(0, 0, 0, 0.3)'
69                         }
70                     },
71                     label: {
72                         position: 'right',
73                         formatter: '{b}'
74                     },
75                     lineStyle: {
76                         color: 'source',
77                         curveness: 0.3
78                     },
79                     emphasis: {
80                         lineStyle: {
81                              10
82                         }
83                     }
84                 }
85             ]
86         };
87
88         myChart.setOption(option);
89     }, 'xml');
90     if (option && typeof option === "object") {
91         var startTime = +new Date();
92         myChart.setOption(option, true);
93         var endTime = +new Date();
94         var updateTime = endTime - startTime;
95         console.log("Time used:", updateTime);
96     }
97 </script>
98 </body>
99 </html>
工程包下载:
https://pan.baidu.com/s/1vD1p3efCpHYJwMUTs8K96g
提取码:fxuk