参考链接:
http://www.voidcn.com/article/p-ppgpswof-bvw.html
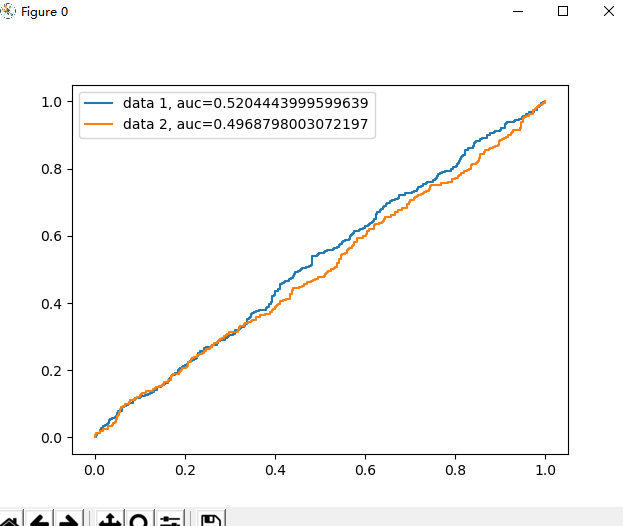
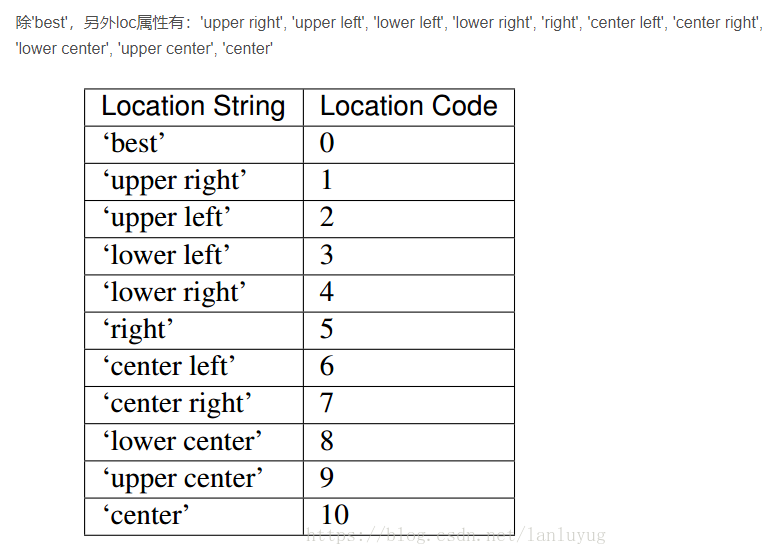
if __name__ == '__main__':
    from sklearn import metrics
    import numpy as np
    import matplotlib.pyplot as plt

    plt.figure(0).clf()  # plt.close()将完全关闭图形窗口,其中plt.clf()将清除图形-您仍然可以在其上绘制另一个绘图。

    pred = np.random.rand(1000)
    label = np.random.randint(2, size=1000)
    fpr, tpr, thresh = metrics.roc_curve(label, pred)
    auc = metrics.roc_auc_score(label, pred)
    plt.plot(fpr, tpr, label="data 1, auc=" + str(auc))

    pred = np.random.rand(1000)
    label = np.random.randint(2, size=1000)
    fpr, tpr, thresh = metrics.roc_curve(label, pred)
    auc = metrics.roc_auc_score(label, pred)
    plt.plot(fpr, tpr, label="data 2, auc=" + str(auc))

    plt.legend(loc=0) # 说明所在位置
    plt.show()
结果: